In Summary
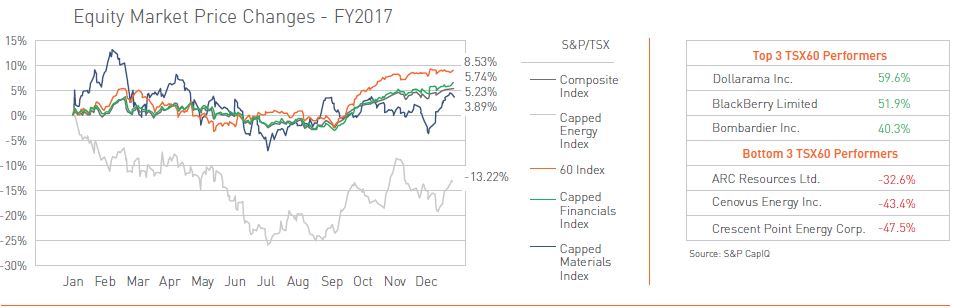
2017 saw the Canadian economy deliver surprisingly strong growth, marking Canada as a standout performer among OECD countries with 3% GDP growth. While this is the fastest pace of growth since 2011 and significantly outpacing 2016’s 1.4% increase, Canadian equities were one of the weaker performing markets in 2017. The S&P/TSX Composite’s 9.1% total return, while still respectable, lagged international indices due to a cooling housing market, continued difficulties with market access in the energy sector and strong performance in the US technology sector.
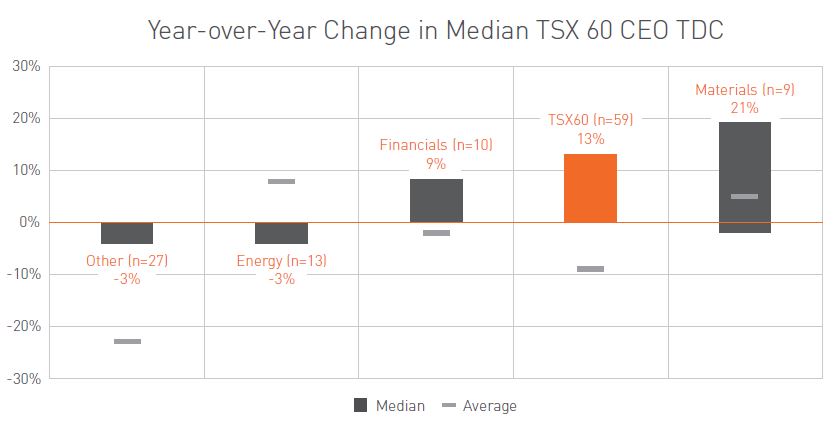
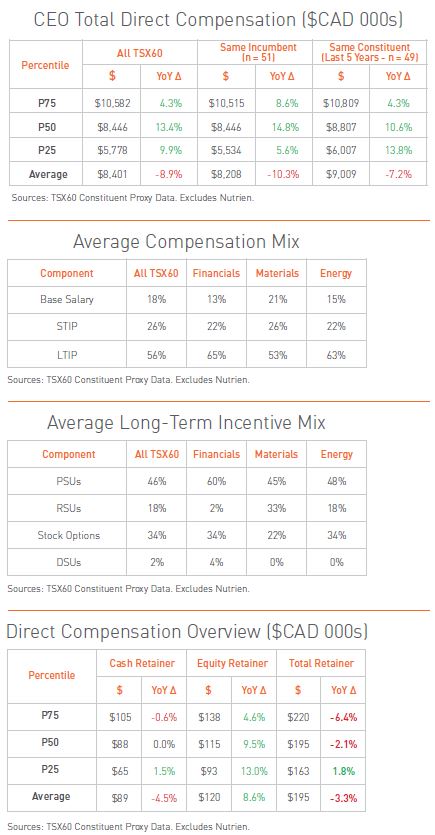 Median CEO total direct compensation (sum of base salary, annual bonus and grant date value of long-term incentives) levels trended upwards with the Canadian markets in 2017, increasing 13% year-over-year to $8.4M. This was largely led by the Financials and Materials sectors, posting 9% and 21% year-over-year increases at the median, respectively. Energy sector CEOs and CEOs in other sectors remained relatively flat with a -3% decrease to median pay levels.
Overall, 2017 saw few major changes to the average structure of incentive design. The results are mixed on a case by case basis, with two issuers introducing stock options into their incentive mix and two others increasing emphasis on PSUs or eliminating stock options entirely.
Say-on-pay support through the 2018 proxy season remains strong among the TSX60 with an average support level of 92%.
Director compensation changed little year-over-year, with the median total retainer decreasing -2% to $195K. The decrease is at least partially due to a stronger Canadian dollar, reducing the CAD value of director pay delivered in USD.
Pay Levels Update
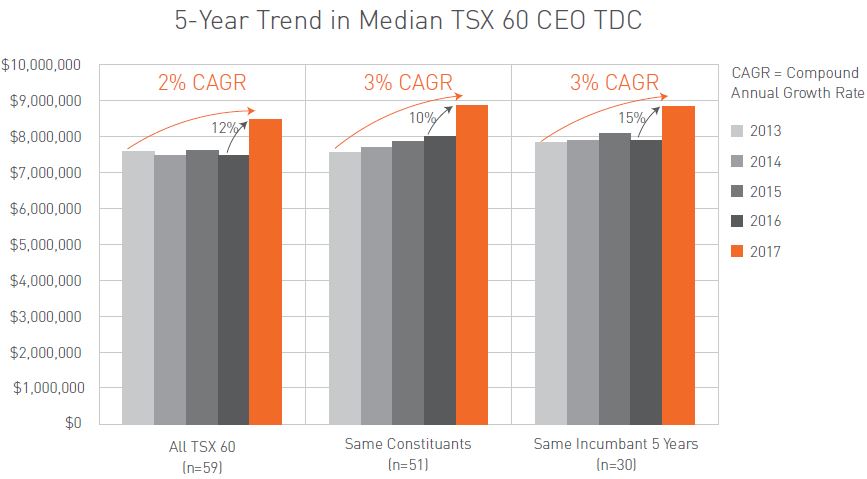
There has been significant media attention regarding the ratcheting up of pay, mostly in the U.S. Looking back at the 2013 - 2016 period, we see that Canadian CEO pay was relatively flat. We expect this is a result of two main drivers: the downturn in the energy sector and a fair degree of CEO turnover with newly appointed executives having pay packages set lower than their predecessors.
However, 2017 had a notable increase in median CEO total direct compensation: the sample of all TSX60 companies increased 13% at the median with a 11% increase for the same constituents (n=49) and a 15% increase for the same incumbent (n=51), largely reflective of the strengthening Canadian economy.
- 30 companies increased their CEO compensation in 2017, with 5 companies increasing their pay by 25% or more (Brookfield, CN, Gildan, Husky, First Quantum)
- Mining saw the biggest increases in CEO pay in 2017 with a 21% increase in median TDC – attributed to the upward pressure on mineral prices and industry optimism after several challenging years
- Financials had the next biggest increase with a 9% increase in median TDC
- Energy median CEO TDC remained relatively flat
What appears to be a 3% decrease in “all other” is attributed to large CEO pay differences in a few companies, particularly in pharmaceuticals. Some changes were so large that it has skewed the average down significantly. Median sits at -3% but the average decline is -23%.
- One of the most notable differences is Valeant Pharmaceuticals, going from a $70 million compensation level in 2016 to $5.8 million in 2017
Pay Design Update
2017 brought few major structural changes to short-term incentive plan (“STIP”) design. On average, companies within the TSX60 have 5 metrics in their scorecards, with one constituent disclosing as many as 17 (Inter Pipeline). Some notable STIP observations from 2017:
- Enbridge expanded their STIP in order to address the Spectra merger by creating 2 distinct performance periods, pre- and post-merger
- TD introduced a return on tangible common equity (“ROTCE”) and a strategic initiatives component to its corporate performance scorecard
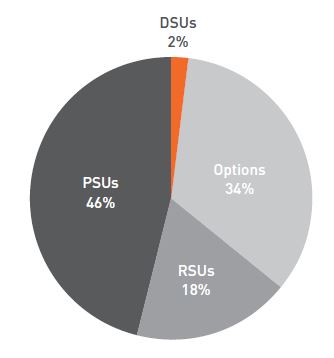
Average target long-term incentive plan (“LTIP”) mix saw little change over 2016, with performance share units (“PSUs”) and options declining slightly in favor of restricted share units (“RSUs”) and deferred share units (“DSUs”). However, 2017 brought major shifts in LTIP mix on a case-by-case basis for some companies. For example,
 Goldcorp eliminated option grants and increased PSUs to 75% of the LTI mix
- Gildan will eliminate stock options starting 2018 (100% PSUs)
- Crescent Point awarded 100% PSUs in 2017; however, will move to a mix of 50% PSUs, 30% options and 20% RSUs in 2018
- Valeant’s annual LTIP mix (as opposed to the CEO on-hire award) is moving to include RSUs and stock options in lieu of some PSUs; ROTC will be added as a PSU metric (in addition to absolute and relative TSR measures)
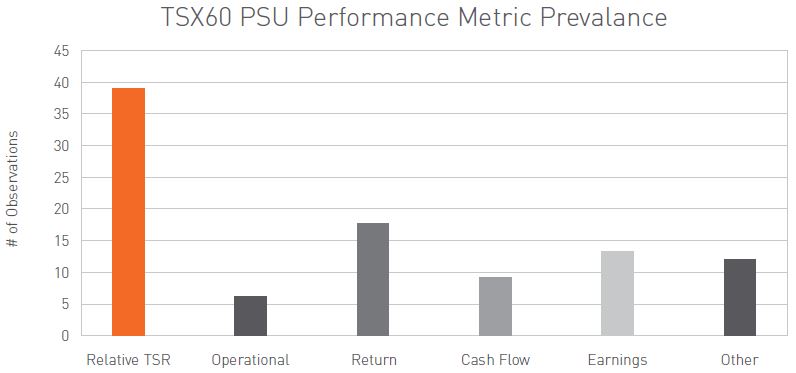
In past years we have seen an increased use of relative TSR, which we expect is a result of more companies adopting PSU plans, rather than existing PSU plans being amended.
- Of the TSX60 issuers disclosing a PSU program, 81% include a relative TSR measure
With the adoption rates of PSU programs reaching maturity over the past few years, a broader trend is emerging in LTIP design, which is a shift away from sole reliance on relative measures (e.g., 100% relative TSR) towards the addition of strategic/absolute measures.
- Goldcorp incorporated NAV/share growth in PSUs, reducing relative TSR weighting to 50%
- Also adopted front-end sensitivity to LTIP grants (+/- 25%) based on individual and company performance
- Teck Resources added EBITDA performance
We note that institutional shareholders have been advocating for more emphasis on absolute performance measures in long-term incentives – more recently in resource industries in particular – in order to focus management teams on generating positive returns, rather than strictly peer outperformance. For example, Ontario Teachers’ Pension Plan recently published a recent article aimed at the oil and gas exploration and production sector, suggesting companies should place more focus on return-on-equity or like measures and absolute TSR in incentive programs.
Director Compensation Update
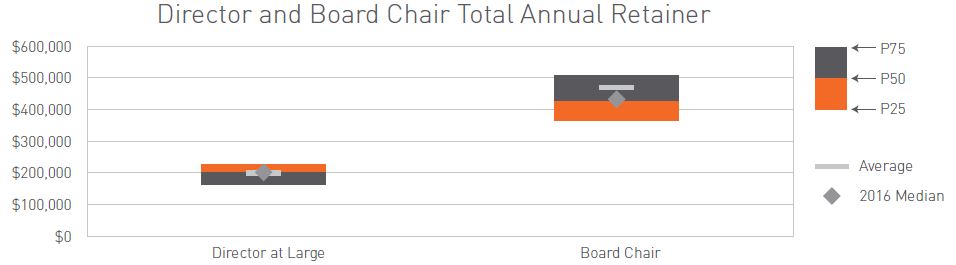
The median total non-executive director annual retainer (including equity) decreased 2.1% in 2017 relative to 2016 to approximately $195K, while the median Board Chair total retainer fell 1.1% to at $420K.
Consistent with 2016, approximately 60% of the TSX60 has adopted a “flat fee” structure whereby directors do not receive per meeting fees.
Say-on-Pay Update
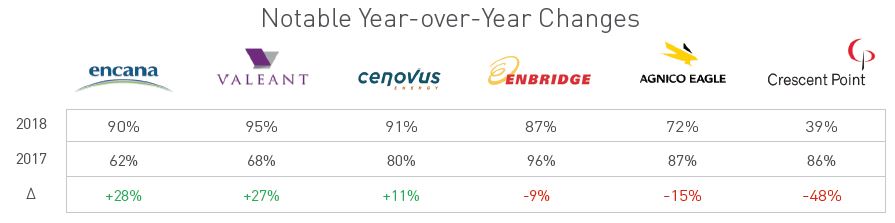
2018 say-on-pay results are shaping up to be in line with recent years, both in terms of average support levels and the occurrence of high-profile failures.
- Average SoP support for the TSX60 issuers is 92% among the 42 companies that have held AGMs to date (as at June 18, 2018)
- There have been 2 failures in Canada to date (Crescent Point, Maxar)
Crescent Point and Hydro One Case Studies

- Minority shareholder, Cation Capital, launches a proxy contest in April, holding 0.3% of outstanding shares
- Cation puts forward 4 nominees
- Board quickly enhances shareholder engagement in response to Cation
- ISS recommended FOR 2 dissident directors and withhold on the remaining 2, which shareholders did not support on May 4th
- Glass Lewis issued a withhold recommendation for all dissident directors

- Hydro One’s executive and director compensation and related governance provisions drew criticism from Ontario
- Province of Ontario (47% owner) abstained from voting on Say-on-Pay. Balance of shareholders voted 92% in favor of SoP
Key Takeaways
- Shareholder activism is here to stay. As well, politicization may increasingly be influential, even in the face of shareholder and advisory group support
- However unlikely it may be, it’s important for the Board to be prepared going into AGM season and able to mobilize quickly, as was the case at Crescent Point and Hydro One
- Respond quickly and cleanly – Crescent Point initiated talks with Cation and approximately a week later issued their proxy and Hydro One responded to public scrutiny in approx. 3-4 days
Proxy Advisor Update
The two main proxy advisory firms, Institutional Shareholder Services (ISS) and Glass Lewis, retained their influential role in SOP voting and broader governance discourse through the 2018 proxy season
- There was a YOY decline in the number of negative recommendations from ISS and Glass Lewis among TSX60 issuers.
- ISS recommended against two TSX60 issuers in 2018 while Glass Lewis has not issued any against recommendations among the TSX60
Shareholder Engagement Update
Direct engagement by independent directors with major institutional shareholders and proxy advisors is becoming a regular part of a director’s role among the largest issuers in Canada. Formal interaction with shareholders is a natural complement to an issuer’s disclosure of compensation practices, allowing institutions to gain the appropriate context to make the most informed voting decisions.
- Among the TSX 60, approximately 40% of constituents now voluntarily disclose details of director led shareholder engagement activities undertaken in the past year, up from below 22% in 2017
- 50% of TSX60 issuers have adopted formal engagement programs led by directors
Some of the most extensive campaigns are of course undertaken by issuers who received poor SoP support at their 2017 AGMs (e.g. CP), or faced proxy challenges (e.g., Crescent Point). Also, boards/issuers who have historically had high levels of support are finding interesting ways to hold productive discussions between directors and shareholders
- In January 2017, BMO’s Chairman hosted an institutional shareholders' luncheon that included all Board Committee Chairs and representatives of 10 investor firms and the Canadian Coalition for Good Governance
Gender Diversity & Pay Transparency
Institutional shareholders, proxy advisors, governments, and individual companies have continued to focus on matters of Board diversity. We also note a growing focus by governments and individual companies on pay equity and transparency.
- Responding to the evolving priorities of the shareholder community, proxy advisors made the following key updates to their 2018 voting guidelines regarding diversity:
- ISS will generally withhold vote recommendation for the Chair of the Nominating Committee (or Chair of the Board) if a company has not adopted a formal written gender diversity policy and does not have any female directors serving on its board
- Glass Lewis beginning in 2019 will recommend against Chair of the Nominating Committee (and potentially the entire Nominating Committee) of Boards with no female members, or without formal written gender diversity policies. For 2018, diversity will be one of many considerations when evaluating companies’ oversight structure
Based on our review of 2018 proxies, 53% of TSX60 issuers had adopted Board gender diversity quotas, up from 47% in 2017.
Regulatory and Disclosure Update
While Canada saw little change in the regulatory environment, 2018 marks the first proxy season where the SEC requires public companies to report the ratio of compensation of their CEO in comparison to that of a median employee.
- Thus far, reporting of this pay ratio has revealed that the metric can vary greatly in accordance to company size and complexity
- As of June 4, 2018 and based on a sample of 2,087 companies¹ , the Median CEO pay ratio is 66:1, with the lowest being 0:1 and the highest as 5,908:1
Proxy disclosure continues to evolve as shareholders and proxy advisors increase expectations for the clarity and comprehensiveness of disclosure. Supplemental and voluntary “realized / realizable” pay analyses continue to increase in prevalence with approximately 50% of the TSX60 constituents.
Conclusion
2017 provided support to the widely-held notion that executive pay levels continue to ratchet higher following minimal change in the median pay levels over the past five years. While the growth in the Canadian economy outpaced expectations in 2017, with CEO compensation largely following the same track, a cooler outlook for 2018 may thwart the upward pay trend before it can start.
Companies continue to refine the balance between evolving shareholder interests and definitions of success. We are seeing a shift in shareholders’ focus over the last year, with increasing discussion on environment, social and governance issues such as diversity, climate change and gender based pay transparency. These issues bring a new level of complexity in performance evaluation and change management that directors will need to address.
Lastly, we continue to witness examples of how focused, direct and proactive engagement with shareholders in advance of major program changes, in the face of a tough performance environment, or even in the normal course, can result in successful support of a company’s approach towards executive pay. Conversely, the failure to provide appropriate disclosure or properly engage, or the appearance of being insensitive to shareholder priorities, can easily catch not only shareholders’ ire, but the public’s as well.
(1) (Equilar, 2018)