Hugessen has completed its annual review of the 2022 TSX60 proxy circulars and we are pleased to share key findings on pay levels, pay design, regulatory updates and Say-on-Pay results. In addition to delivering our TSX60 proxy takeaways, we have provided commentary on other topics including board effectiveness, how to navigate the war for talent in an inflationary environment, and the impacts of geopolitical conflicts on compensation.
Please click above for the webinar recording, download the TSX60 slides here and the full briefing here.
In Summary
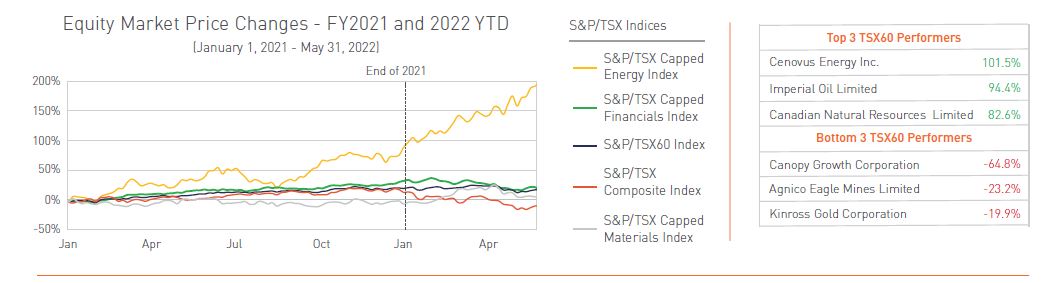
The S&P/TSX60 experienced a strong rebound in 2021, finishing the year with a return of approximately +24% above pre-COVID levels. However, in wake of the war in Ukraine, rising interest rates, supply chain disruptions, and the associated decline in the macroeconomic outlook, the TSX60 and S&P/TSX Capped Financials Index have fallen by nearly 11% and 12% YTD, respectively. The impact of such trends on global oil prices continues to benefit energy companies, with the S&P/TSX Capped Energy Index recording a +71% return in 2021, and a +42% return YTD.
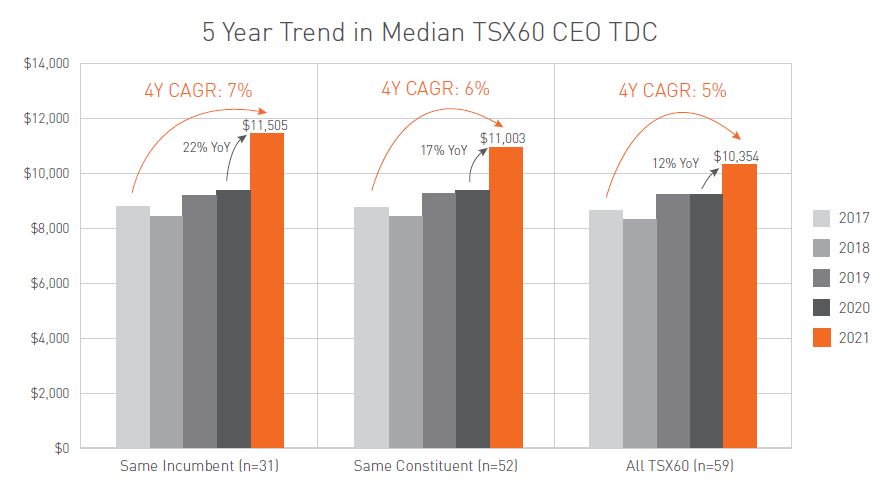
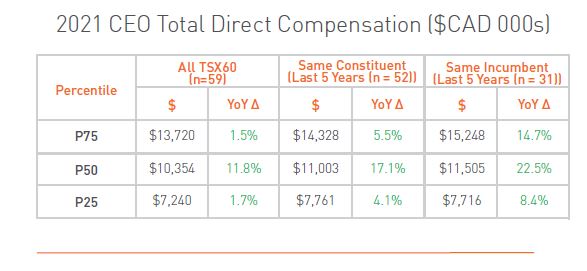 Among the TSX60 in 2021, median CEO total direct compensation (sum of base salary, annual bonus and grant date value of long-term incentives) increased by nearly 12% year-over-year, with same incumbent CEOs experiencing a close to 23% increase relative to 2020. This follows relatively stable CEO pay levels in 2020, largely driven by the impacts of the COVID pandemic, which led to historically weaker corporate performance scores.
 Incentive plan design remained relatively stable compared to 2020, with the most notable change being the increased use of Environmental, Social, and Governance (“ESG”) metrics in corporate scorecards (42 companies now use an ESG metric within their Short-Term Incentive Plans (“STIPs”), compared to 37 in 2020). We expect this trend to continue as shareholders increase their emphasis on items related to environment, social, and governance topics.
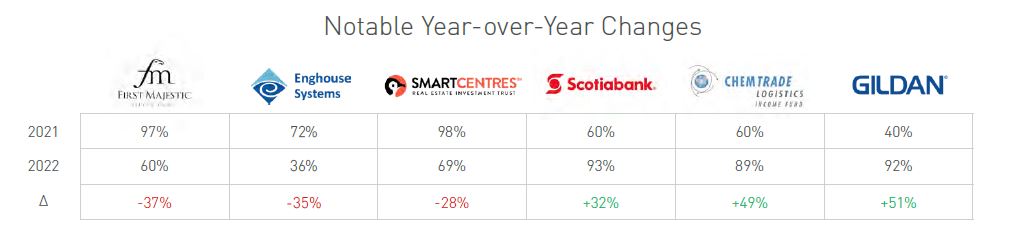
 Consistent with 2021, Say-on-Pay (“SoP”) support throughout the 2022 proxy season has remained strong with an average support level of 94% for TSX60 companies (and 91% for the broader TSX Composite Index). We note a few significant year-over year decreases among the TSX Composite, such as Enghouse Systems with a SoP result of
37% (-36% change YoY), and Aimia with a SoP result of 68% (-19% change YoY).
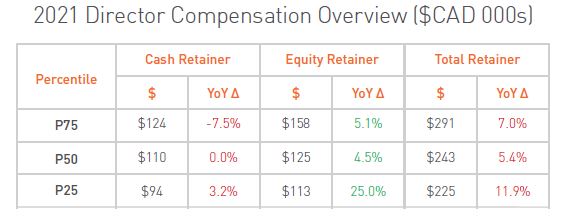 Median Board director annual total retainer increased by 5% in 2021, compared to a 2% increase in 2020. The use of a flat fee compensation structure remains common with over 80% of the TSX60 constituents using this structure.
2021 Pay Levels Update
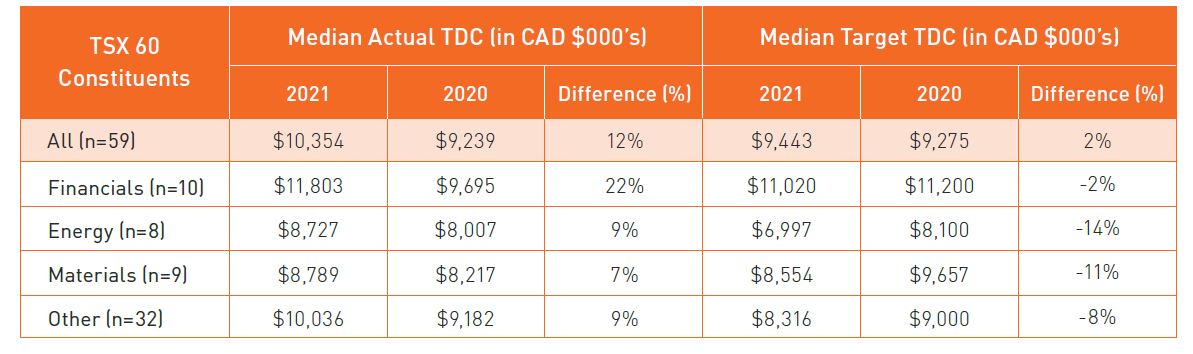
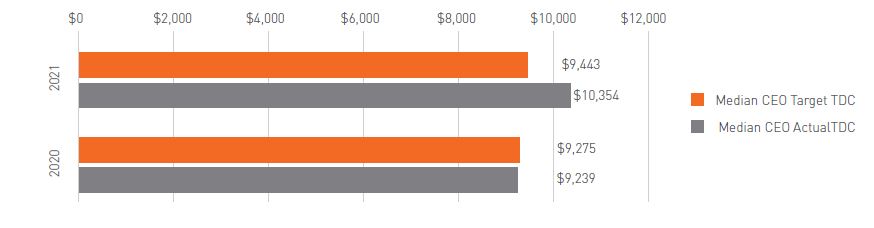
Median actual pay for TSX60 CEOs increased by approximately 12% year-over-year, in stark contrast to the relatively flat pay levels observed in 2020. The most notable year-over-year CEO TDC increases in 2021 were within the Financials and Energy industries, which experienced a median increase of ~22% and ~9%, respectively. Such increases can be partly attributed to the underlying resurgence in core operating metrics year-over-year, better scorecard results, and larger Long-Term Incentive Plan (“LTIP”) grants. Additionally, these sectors saw an improved financial outlook, while the Energy industry benefited from a historic surge in oil prices through 2021.
Overall, we expect that the increase in CEO pay levels in 2021 was driven by the enhanced macroeconomic outlook as COVID-related uncertainties gradually diminished in 2021, leading to better-than-expected business performance. This is highlighted by the average corporate performance score among TSX60 constituents being 133% in 2021, compared to 96% in 2020. Such historically high scores typically lead to greater actual incentive payouts, which explains in large part the difference between the year-over-year increases in actual pay vs. target pay (please see the table above).
When observing pay levels for companies that have been in the TSX60 for the past 5 years (“Same Constituent”) and for CEOs that have been in their respective roles for 5 years (“Same Incumbent”), same Constituent CEO median compensation experienced a material increase of ~17% between 2020 and 2021, standing at the highest level over a 5-year period. Among Same Incumbent CEOs, the observed year-over-year increase in median compensation is even greater at ~22%, with a 4-year compounded annual growth rate (“CAGR”) of 7%.
Changes to Target Compensation Levels
When looking at the change in target versus actual compensation, the target total direct compensation at median was generally flat between 2020 and 2021, while actual TDC increased by approximately 12%. As noted above, the relatively higher increase in actual TDC compared to target TDC can be tied to the historically high corporate scores recorded in 2021 among the TSX60.
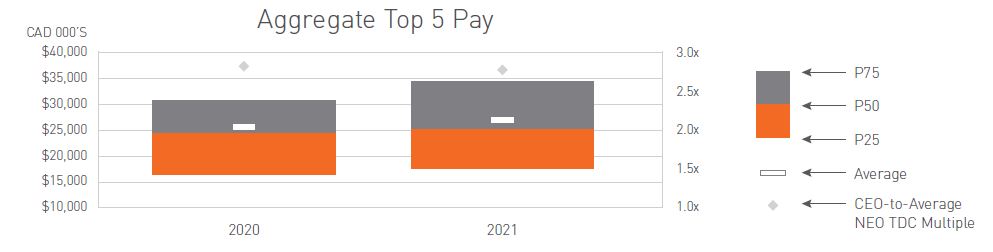
Named Executive Officer Compensation ($CAD 000s)
For the top 5 named executive officers (“NEOs”), actual total direct compensation (“TDC”) at median increased year-over-year by approximately 3%, while the CEO-to-average-NEO actual TDC multiple remained flat
year-over-year at ~2.8x.
Pay Design Update
Short-Term Incentive Plan
In 2021, companies within the TSX60 that used a short-term corporate scorecard had an average of five metrics (note: excludes any “individual” scorecard components). Consistent with prior years, almost all TSX6 0 issuers (55 / 59) used a financial metric, and these metrics remain by far the largest component of corporate scorecards (72 % average weighting). TSX60 constituents continue to increase the use of ESG metrics, with the average weighting increasing from 10% to 14% year-over-year1, although the number of issuers incorporating an ESG metric (37) remained flat in 2021. Beyond financial and ESG metrics, 21 (35%) of the TSX60 used an operational metric, and 14 (23%) used a strategic metric in their STIP. See the illustration below for some commonly used metrics within short-term incentive plans. Looking past score card design, performance outcomes improved significantly in 2021, with the average corporate STIP score increasing from 96% to 13 3 % year- over-year. In addition, the number of companies that applied discretion when calculating performance decreased from 26 to 14 year-over-year. These changes are not entirely surprising as the impacts COVID-19 had on corporate performance were far less substantial in 2021 than in the previous year.

Long-Term Incentive Plan
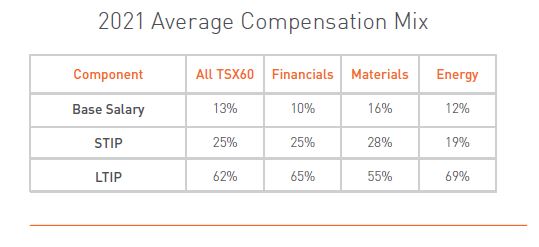
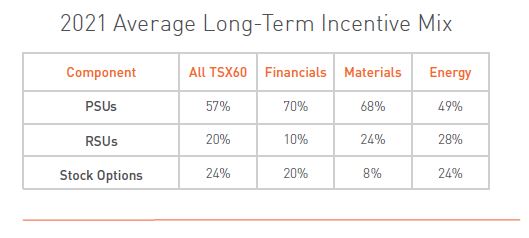
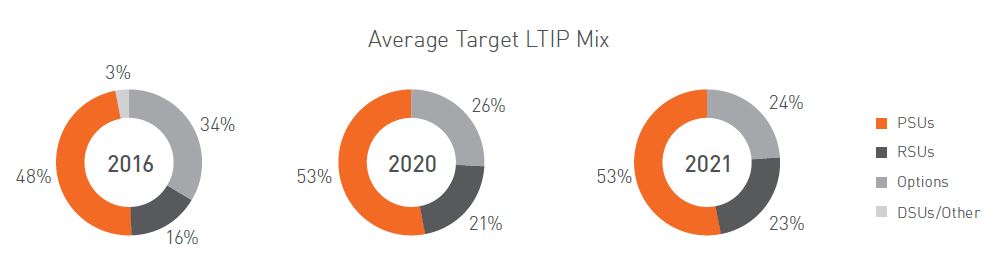
In 2021, the average target CEO LTIP mix continued to gradually shift away from stock options (see table below), with 64% of the TSX60 using stock options in 2021, compared to 68% in 2020. Adjustments to option taxation did not result in wholesale changes in 2021, and we expect stock options to remain an important equity instrument in companies’ long-term incentive plan designs. We expect the weighting of stock options in the LTIP mix to stay in the typical range of 20% - 25% for the foreseeable future. Shifting our focus to performance measurement, relative Total Shareholder Return (“relative TSR”) remains the most prevalent metric in Performance Share Unit (“PSU”). 71% of TSX60 issuers that granted PSUs included a relative TSR measure (37/52). In comparison, 73% of the TSX60 included a relative TSR metric in their PSU plan in 2020, representing a relatively minor shift year-over-year. In 2021, we also saw four companies (Algonquin Power, Fortis, Waste Connections, and Teck) either add an ESG metric to their PSU plans or state their intention to do so. As a result, 21% (13/60) of the TSX60 now incorporate an ESG metric into their PSU plan, with the most common ESG metrics being environmental (11/13), employee (9/13), community and stakeholder (6/13) and Diversity, Equity, and Inclusion (“DEI”) (6/13) metrics.
Director Compensation Update
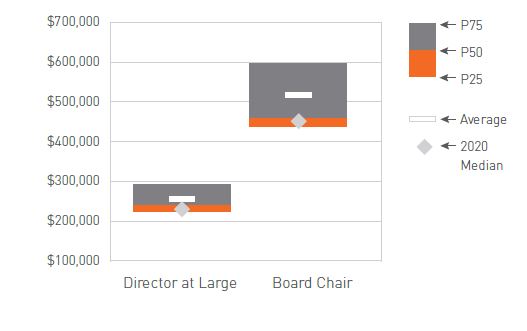
The median total annual retainer (including equity)2 paid to non-executive directors increased by 5% in 2021 to approximately $243K, while median Board Chair pay remained relatively flat with a 2% increase to $460K. Due to the COVID-19 pandemic, we saw several companies choosing to delay increases to director compensation throughout 2020, which is likely a driver of the 5% increase in 2021. No major changes to director compensation structure or approach were observed this year.
Say-on-Pay Update
As of July 1, 2022, 2022 Say-on-Pay results are consistent with recent years in terms of average support levels, with average YTD SoP support at 91% in 2022 (n = 160) compared to 90% in 2021 (n = 196). Among the TSX60, 2022 Say-on-Pay (“SoP”) results to date are also consistent with recent years in terms of average support levels: Average YTD SoP support for the TSX60 issuers is 94% among the 32 companies that have held Annual General Meetings as of June 24, 2022, compared to an average SoP of 92% across 42 constituents at this time in 2021. Gildan Activewear has seen the largest increase in SoP support this year, increasing from 40% in 2021 to 92% in 2022 (+51% YoY). First Majestic Sliver experienced the most significant decrease in SoP results so far in 2022 (60%, -37% YoY), and also received an AGAINST recommendation from Glass Lewis. In our experience, SoP votes are at times used as an avenue for shareholders to express their discontent towards management or directors, often due to weak company performance. Accordingly, issuers experiencing negative SoP results may wish to engage directly with their shareholders to better understand the underlying reasons for the vote results.
Board Effectiveness Update
Board effectiveness and the disclosure of Board effectiveness practices is prominent among TSX60 constituents, being disclosed by 58 of the 59 constituents. The disclosure of Board effectiveness practices has become table stakes and includes topics such as board evaluations; goal setting, feedback, and appraisal practices; skill matrix and Board composition definition; CEO transition advisory; and Board search priorities and practices.
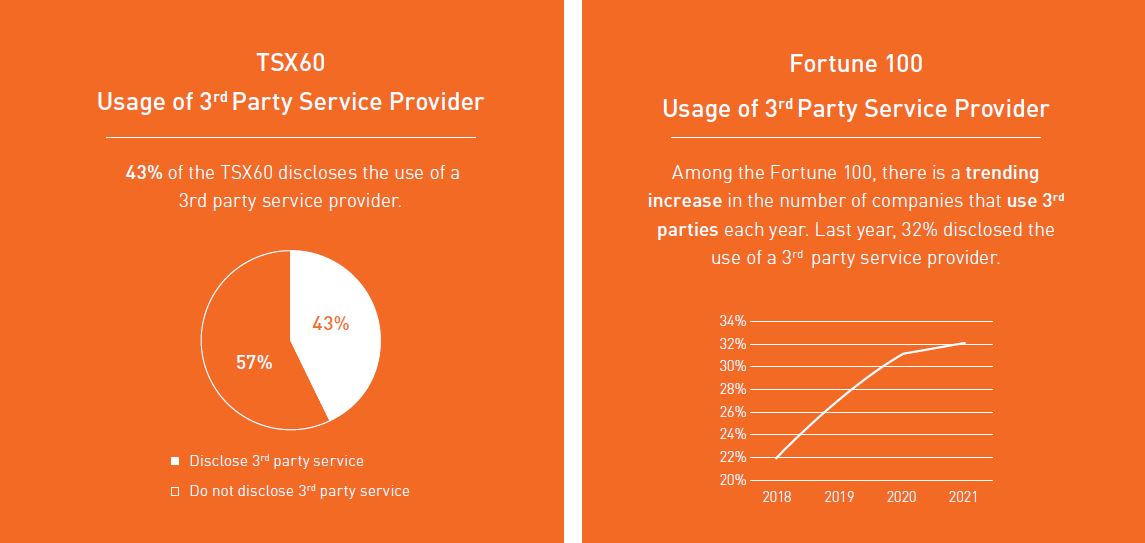
43% of the TSX60 discloses the use of a third-party service provider. Among the Fortune 100, between 2018 and 2021, there was a large surge in the use of third-party support. In 2018, only ~1 in 5 Boards were engaging external advisors, with that number rising to ~1 in 3 Boards in 2021. We expect to see a similar trend in Canada with the increased focus on governance and Board effectiveness3.
Nearly half of TSX60 constituents that disclosed their Board evaluations also disclosed details on the topics addressed, including board procedures, succession planning, risk management, the effectiveness of communication, adequacy and timeliness of materials, and the relationship with Management. All of the aforementioned topics are drivers towards making Boards more effective. The topic of the Board’s relationship with Management and within the Board itself has been prevalent over the past year as more in-person meetings are starting to occur and the opportunity to foster stronger relationships is more present through pre-and-post-meeting conversations, lunches, etc.
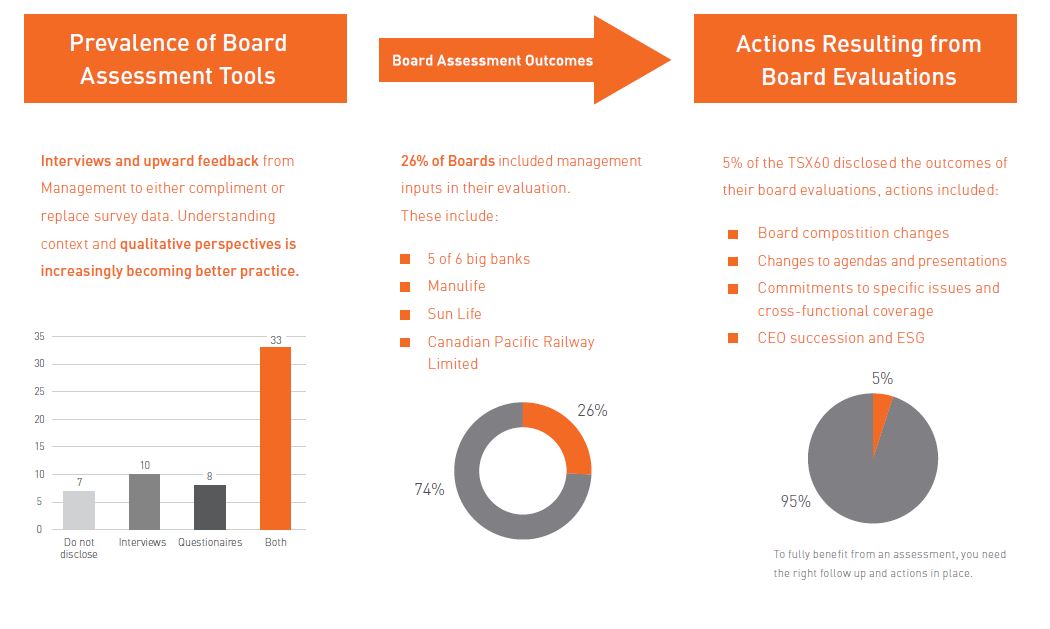
Board assessment tools have evolved over the past few years, shifting from primarily survey-centric feedback to now incorporating one-on-one interviews as well as peer and Management feedback to compliment the survey results. These leading tools show that understanding the context and qualitative perspectives is increasingly becoming better practice.
While only 5% of the TSX60 disclosed the outcomes of their Board evaluations, we note that the actions disclosed are both achievable and would likely improve the quality of the Boards. These items include: board composition changes, changes to agendas and presentations, commitments to specific issues and cross-functional coverage, and CEO succession.
ESG Update
As of the 2022 proxy season, 75% of TSX60 companies have formally incorporated ESG into their compensation plans in some capacity, or have disclosed their intention to do so in 2022. Several companies also increased the relative weight of ESG metrics within their incentive plans year-over-year (now 17% of total). For the companies that have defined the weight of ESG metrics within their STIP or LTIP programs, these metrics are weighted at approximately 20%, on average, which is similar to the past few years.4 68% of TSX60 companies that incorporate ESG metrics in their incentive plans do so in only the STIP, and 27% have ESG metrics in both the STIP and LTIP. A key theme observed among TSX60 companies of all industries has been a focus on incorporating environmental / climate related metrics within their incentive programs.
In Summer 2022, Hugessen delivered a webinar titled Emerging Trends in Executive Compensation and ESG and released a three-part series on ESG in Compensation throughout the summer. If you would like more details on this topic, we encourage you to visit our website.
Other Relevant Topics

In 2021, competition for talent increased in intensity and many companies observed a material run up in what constituted competitive pay at the junior and middle levels, particularly within law, finance and technology. As a result, companies have been experiencing broader pay pressures across their organizations in an effort to limit pay compression and maintain competitiveness, both internal and external. However, some companies may view this as an opportunity for a “soft landing”, where the historically significant “median worker” to CEO pay gap could be narrowed. Companies will have to decide if they want to allow for this compression or maintain the gap, and to what degree.
To add to the compounding wage pressures and elevated inflation, we are also now operating in an environment with weaker equity values. This is particularly pronounced in the technology sector, whereas banks, energy companies, and retailers have been less impacted. Companies will have to determine how they should approach their LTI programs in this environment, and may need to consider: the pressure the current equity program is putting on the treasury reserves at weaker values, if LTIP eligibility should be curtailed, and if the grant date fair value of the equity awards should be cut back to maintain the sustainability of the plan. Additionally, some companies will have to manage how to navigate layoffs while trying to maintain top talent with depleted equity pools.
Paired with weakening equity values, we are seeing the "War for Talent" lose some momentum as layoffs are increasing in prevalence and companies are shifting compensation resources to the most specialized talent areas. Employees who may have recently considered leaving their company may now see an opportunity within their current organization to lead a turnaround given the current market environment and their knowledge of both the sector and company.

The ongoing conflict between Russia and Ukraine has directly impacted Canadian companies with operations in either or both of these countries and has indirectly impacted even more companies through supply chain disruptions and commodity prices. The extent to which these direct and indirect effects should impact year-end performance will vary on a case-by-case basis. The Compensation Committee and Management will have to assess the situation to see how, and if, compensation should change to reflect these impacts. We recommend that Committees and Management teams are transparent in their chosen approach both internally and externally. Conversations on the impacts of the geopolitical conflict should start sooner rather than later, and different scenarios should be discussed early and often so neither party is surprised by the outcome. These conversations should make year-end disclosure easier as Management can clearly disclose how they considered the impacts on compensation outcomes, and will allow them to clearly articulate their approach when discussing pay outcomes with proxy advisors and shareholders
References
1Methodology is based on average weighting of ESG metrics in corporate scorecards (versus total STIP), and of all TSX60 companies (not just
those with ESG metrics).
2 These amounts exclude Committee fees.
3 (* EY Center for board Matters: How boards are strengthening their self-assessments and related disclosures, October 2021).
4 "Methodology is based on weighting as a percent of STIP or LTIP (i.e., both corporate and individual components), for only those companies that
include ESG metrics in their plans".