Introduction
As shareholders and proxy advisors become increasingly demanding, Canadian public companies have enhanced their disclosure to better articulate the linkage between pay and performance. With this disclosure, we can now see the patterns of board-determined corporate performance scores. The pattern of these scores, as presented in this article, reflects the director community’s standards of expected performance and is helpful context for key stakeholders – e.g. boards, shareholders and management – as they assess a company’s performance against business plan goals, and relative to other companies.
This analysis has implications for Boards as they consider performance standards (e.g. “how often should we pay maximum? Target? Minimum?”), performance assessment, disclosure, pay benchmarking and incentive design and may used by stakeholders in discussions about executive pay, and its alignment with performance.
Our Approach
Hugessen conducted a six-year look-back, gathering annual short-term incentive plan corporate performance scores for constituents of the S&P/TSX 60 for the years 2012 to 2017.
We narrowed our analysis to companies with payout ranges of 0 – 1.5x or 0 – 2x, which made up about 78% of disclosed scores during that period.
What Boards Should Know
- Disclosure of corporate scores among TSX60 companies increased from 62% to 77% between 2012 and 2017
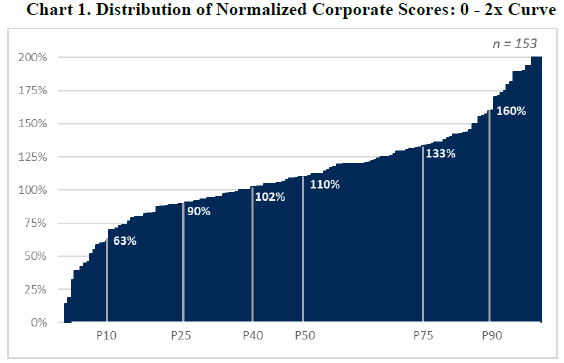
- For companies with a 0 – 2x payout range, the median score for corporate performance was 1.1x target; the 25th to 75th percentile scores range from 0.9x to 1.33x
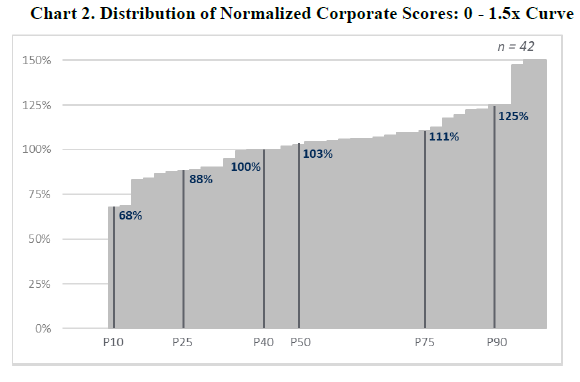
- For companies with a 0 – 1.5x payout range, the median score for corporate performance was 1.03x target; the 25th to 75th percentile scores range from 0.88x to 1.11x
- For both data sets, approximately 60% of the scores are at or above target (1.0x)
Summary of Findings
Corporate Scores Show a High Side Bias
Rather than a normal distribution of corporate scores around target (i.e., 1.0x), the median under both sample sets shows a skew above target.
Corporate Scores are Clustered in a Narrow Range
The distribution of corporate performance scores is clustered, with 50% of the performance scores falling within approximately 20% of the performance range.
Minimum scores (0.0x) and max scores (1.5x or 2.0x) are rare with only 6 and 5 scores, respectively, across both samples.
The distribution of typical payouts within a relatively narrow range may be consistent with the concern we hear from some directors and shareholders that executive bonuses do not vary sufficiently with performance.
Key Considerations
This analysis gives boards and stakeholders information to inform decisions on corporate performance assessment, pay benchmarking and incentive design.
Goal Setting, Performance Assessment and Disclosure Implications
- Assess your company’s historical corporate scores, as well as the rigour of the goal setting process – especially if the degree of difficulty between minimum and target performance, and target and maximum performance are not equal – that is, performance goals are asymmetric (“do our corporate performance scores align with our performance?”)
- Assess the competitiveness of your goal setting processes relative to peers – compare your company’s historic corporate scores and financial results to those of peer companies (“are our targets competitive?”)
- Combine this information with scenario testing to gauge potential payouts based on performance at varying degrees of difficulty (“what is a competitive standard of performance?”)
- Apply a comprehensive perspective to assess corporate performance (i.e. go beyond the mathematics of the scorecard) – for boards about to award a score in the top decile, are you confident the company performed at that level?
- Consider enhanced disclosure and corporate communication, particularly for issuers whose scores differ meaningfully from median and from peers
- Pay Benchmarking and Incentive Design Implications
Pay Benchmarking and Incentive Design Implications
Boards should be aware that actual corporate scores tend to exceed target and consider this information when benchmarking pay and making incentive design decisions:
- If actual pay data is being used to set target short-term incentive plan (“STIP”) awards and target total direct compensation, consider applying a discount to actual short-term incentives
- Expect actual payouts to be above target on average – this is particularly true where companies have a multiplicative short-term incentive formula (i.e. personal score multiplied by the corporate score)
- Where the granting or vesting of long-term incentive plans (“LTIP”) are linked to corporate performance scores, expect to make above target LTIP awards or payouts on average
Potential Pressure to “Stretch” Performance Range
Sophisticated shareholders and advisory firms, as well as management, pay careful attention to the mechanics of pay programs, and both may push for a wider distribution of scores.
Shareholder’s use tools, such as Say-on-Pay, to voice concern about compensation-related issues. They have pushed for more transparency on the board’s assessment of corporate performance and may push for scores below 0.9X when they perceive performance to be below the 25th percentile.
Management may push for scores above 1.3X when they perceive performance to be above the 75th percentile. Management may also push for narrower performance ranges to allow for higher payout multiples if they perceive the performance standards to be set too high.
Conclusion
This analysis provides context for how corporate results translate to pay multipliers in annual short-term incentive programs. With it, stakeholders can better determine whether the assessment of company performance is aligned to the market or is an outlier. The “market”, as considered in this analysis, illustrates a high-side bias and a clustering of scores.
As shareholders are increasingly using this information to encourage greater alignment between pay and performance, Boards and executives will want to further calibrate their corporate performance goals and actual scores relative to this information. Given findings from this analysis, we encourage Boards to review the rigour of their goal setting and performance evaluation process, and consider changes to that process, or to disclosure, as required.