The approach to long-term incentives among small and mid-cap TSX companies tends to vary, in some cases quite significantly, from those of large-cap issuers.
- This is often a reflection of differences in business models, growth and risk profiles, levels of sophistication, and shareholder community expectations
- Over time, however, certain practices favoured by the larger issuers tend to “trickle down” into use by small and mid-cap issuers. This document provides a high-level snapshot of LTIP practices for CEOs of Canadian small and mid-cap issuers in 2015
- The analysis is based on the review of 111 TSX issuers across industries with: 1) market capitalizations ranging from CA$500M to CA$1.5B, 2) headquarters in Canada, and 3) non-zero revenues (i.e. excluding early-stage mining, oil and gas, and pharmaceutical companies
LTIP Mix
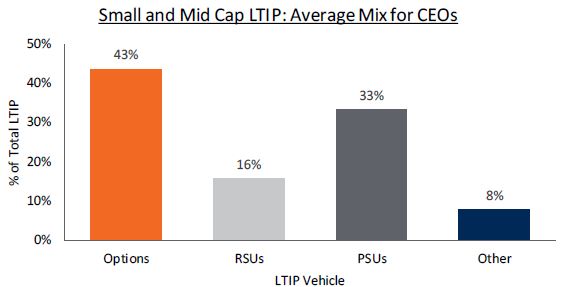
Stock options remain the instrument of choice, but PSUs are becoming more prevalent
Glossary of Key Terms:
RSU: restricted share units; “phantom” shares that track the value of the underlying company share on the public markets and are typically subject to time-based vesting conditions
PSU: performance share units; similar to RSUs, but vesting and settlement of grant are subject to achievement of performance conditions
- Stock Options constitute the largest portion of the CEOs’ LTIPs (an average of 43% of LTIP)
- Reflecting trends observed at larger companies and the influence of the shareholder community, full value share units (i.e., RSUs, and particularly PSUs) are becoming a substantial element of LTIPs for CEOs (PSUs representing 33% of LTIP, on average)
- In comparison, among the S&P/TSX60 the use of
 options is notably lower (average CEO LTIP mix of 44% PSUs and 34% options); we note that the use of options below the senior executive level is significantly less prevalent among TSX 60 companies as well
Most companies granted more than one type of LTIP vehicle in 2015
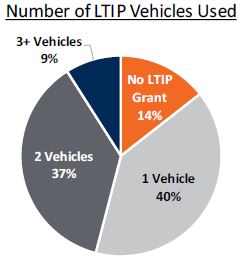 46% of companies that granted an LTIP to their CEO in 2015 used two or more vehicles (typically some combination of options and either RSUs or PSUs)
- However, a significant minority (14%) of issuers did not grant any LTIP to their CEO in 2015; generally reflects challenging business circumstances in the oil and gas and mining industries, but also atypical ownership situations such as significant family or insider control
Graded vesting is the most common practice for options and RSUs; cliff is for PSUs
- A significant majority of option and RSU programs
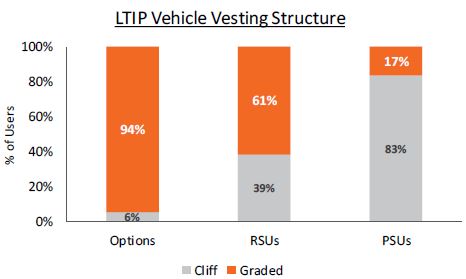 (94% and 61%, respectively) provide for ratable vesting (i.e., vesting over time, such as a 3-year RSU award that vests 1/3 per year)
 - To contrast this, most PSU programs (83%) cliff-vest at the end of their performance periods (i.e. award vests fully at the end of year 3)
Performance Conditioning
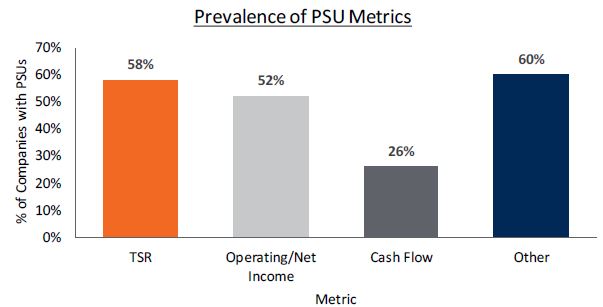
TSR is the most common PSU metrics, but financial metrics are also prevalent
-
56% of companies that had PSU programs in place used a market-based measure, most commonly absolute or relative total shareholder return (“TSR”)
- Other notable metrics used by a significant number of issuers reviewed include earnings measures (52% of companies that have PSUs) or cash flow measures (26%)
- Interestingly, the use of share price metrics is more prevalent for TSX60 companies (73% of TSX60 companies that have PSU programs use this metric); perhaps reflecting the volatility of small and mid-cap issuers’ share prices and/or difficulty finding appropriate performance benchmarks (i.e., indices or peer groups)
 The “other” metrics used in PSUs were diverse; some included:
- Industry-specific operational metrics (e.g., recycle ratio, production)
- Return on equity or capital measures
- Strategic measures
- Roughly half of issuers that granted PSUs used one metric (52%), and half used more than one measure (48%)
Issuers that used more than one metric in their PSUs tended to have a shareholder return-related metric
- Of those who used more than one performance
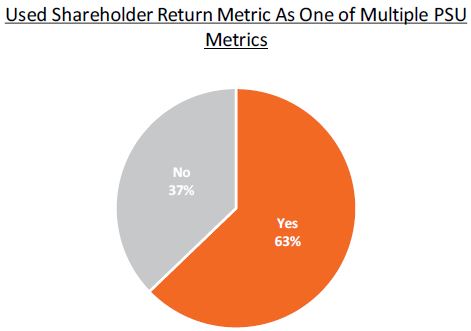 metric in their PSUs and used a shareholder return-related metric, most used relative TSR
 - This is likely due to its ability to neutralize factors outside of management control, simplicity to calculate, and applicability across industries