Executive Summary
Strong market performance in 2025 boosted CEO pay, with outcomes varying by industry. Canadian equities delivered robust returns despite modest economic growth, and CEO compensation rose on both a target and an actual basis. Operating environment uncertainty produced divergent performance outcomes across industries. Volatility can change the reality of a business quickly, and Boards should continually monitor the implications for overall program effectiveness.
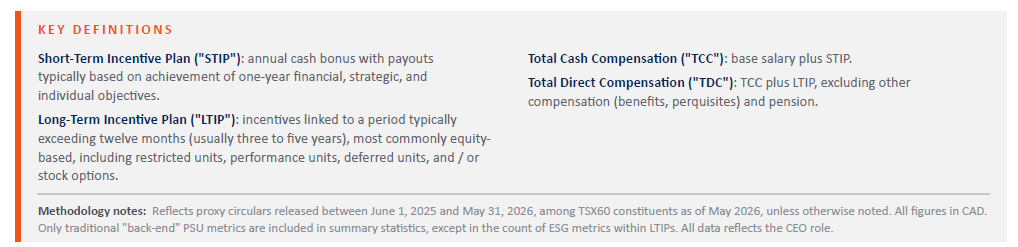
Short-term incentives increasingly prioritize flexibility and judgement through non-financial metrics. Performance assessment has shifted from formulaic standards toward judgement-based and inherently subjective measures, which raises the bar on articulating what success looks like upfront. Discretion remains a tool Boards use to align pay outcomes with business realities and management effort. In our experience, the most successful processes define success at the start of the performance period, track progress through regular discussion with management, and adapt as conditions change.
Stock options remain relevant in the right context. Average option usage in TSX60 long-term incentive programs has declined 5 percentage points over five years. In our view, options remain a relevant tool, but their use requires careful consideration of business context and long-term strategy. Relative TSR PSUs remain the most common structure, but consolidation in certain markets is pressuring performance benchmarks. With few available peers in some industries, management teams and Boards are expanding peer scope or adopting an established index as the relative TSR benchmark, a dynamic that extends beyond the TSX60, particularly in Energy.
Sustainability and ESG metrics continue to shift in response to policy changes in Canada and the U.S. Companies navigated scrutiny of diversity and inclusion metrics in the U.S. alongside uncertainty around anti-greenwashing legislation in Canada. The TSX60 saw a decline in ESG metrics in both STIP and LTIP, though this is partially attributable to index constituent changes. Hugessen's discussions in the broader market suggest this reflects management of disclosure and risk and simplification of incentives, rather than wholesale change in strategy or corporate priorities.
Boards have stepped up how they assess their own performance. Surveys remain effective for identifying themes, but many Boards are adding facilitated interviews to understand the context behind feedback and explore actions. Incorporating upward feedback from management helps Boards identify opportunities to strengthen effectiveness and improve Board-management dynamics. This renewed focus is shifting the conversation away from age- and term-based director limits toward a more strategic approach to renewal centred on performance and skills.
2025 Market Performance Overeview

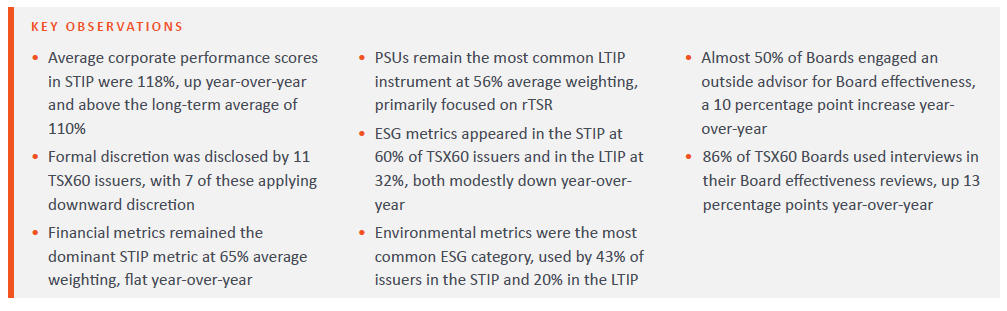
Markets declined meaningfully in late Q1 and early Q2 2025 amid concerns over global growth, the pace of interest rate cuts, trade and tariff tensions, and commodity price volatility. Sentiment shifted in April as uncertainty around U.S. trade relations eased, and the TSX60 recovered all losses by mid-year, strengthening through year-end and into 2026.
Canadian equities delivered strong returns in 2025, with the S&P/TSX Composite Index up ~27%, outperforming the S&P/TSX 60 Index (~25%) and the S&P 500 (~17%), despite modest GDP growth of 1.7%.
Average corporate STIP scores rose from 112% in FY2024 to 118% in FY2025, while median PSU performance multipliers held relatively stable at ~100%.
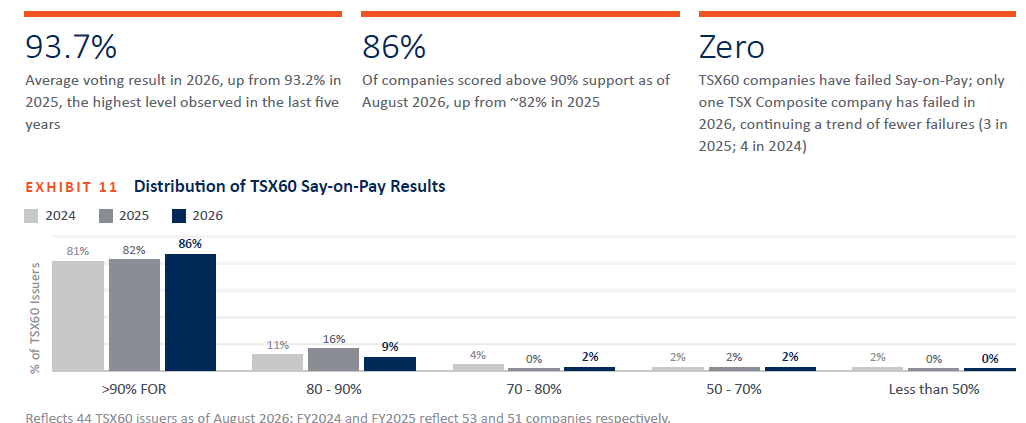
The combination of healthy corporate performance and even more robust share price returns formed the strong pay-for-performance narrative for the year. This likely carried an increase in Say-on-Pay support (see Exhibit 11).
2025 Pay Levels Update
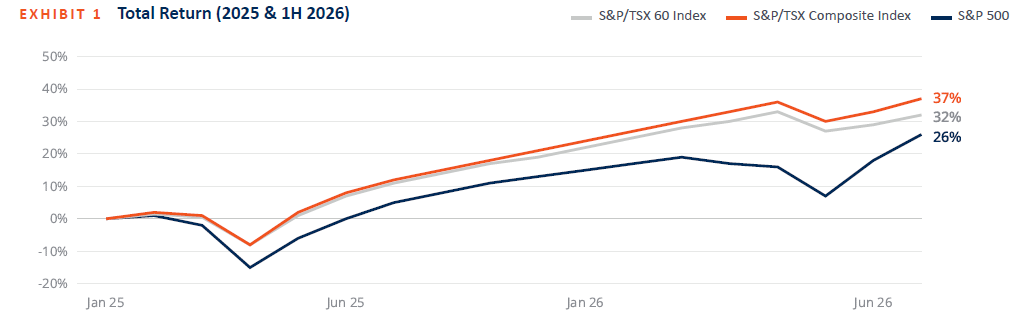
Both target and actual compensation increased materially in 2025 at median despite several CEO successions, reflecting meaningful increases among tenured CEOs. Alongside strong financial performance, we expect that pressure from the U.S. market is increasingly reflected in more North American-centric pay philosophies and peer groups, driving TSX60 CEO target compensation upward.
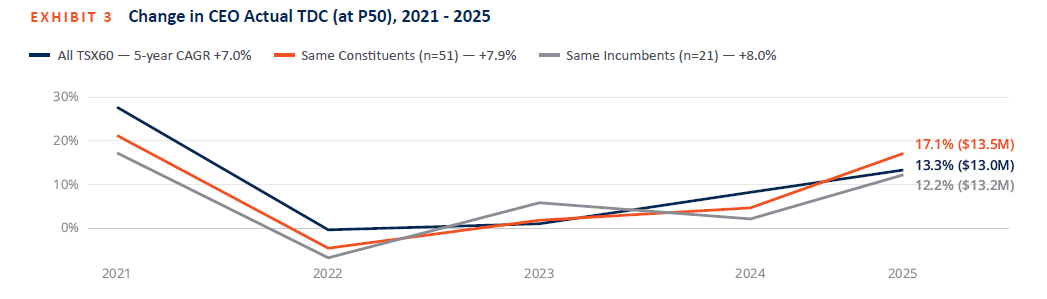
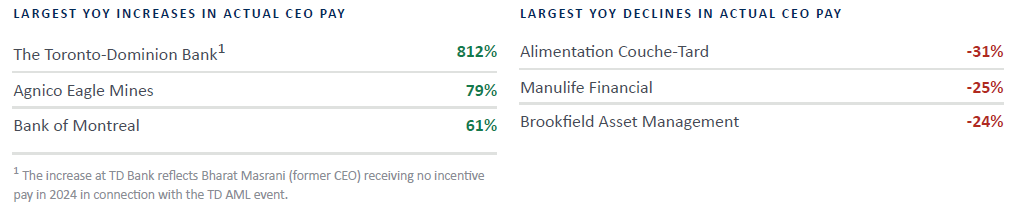
Median target TDC among TSX60 CEOs increased 9.9% in 2025, compared with 6.2% in 2024. On an actual basis, median CEO TDC increased 13.3%, driven by above-target STIP payouts and large performance-related LTIP grants. Financials and Energy saw the largest increases in actual CEO TDC: Financials rose 22.9%, aligned with strong performance across the six largest Canadian banks, while Energy rose 12.5%, continuing a multi-year trend of double-digit growth (20.5% in 2024).
Change in CEO Actual TDC (at P50)
Longer-tenured CEOs have seen stronger pay growth than the full index over the past 5 years, though lower growth for 2025 only. Among the 21 CEOs who held their roles for the full five-year period ("Same Incumbents"), median actual pay CAGR was 8.0% and increased by 12.2% in 2025.
Growth has also been strong among established index members. Among the 51 issuers that were TSX60 constituents throughout the period ("Same Constituents"), median CEO actual pay increased 17.1% in 2025, against 13.3% across the broader TSX60, with five-year growth of 7.9%, versus 7.0% for the full index.
CEO Transitions
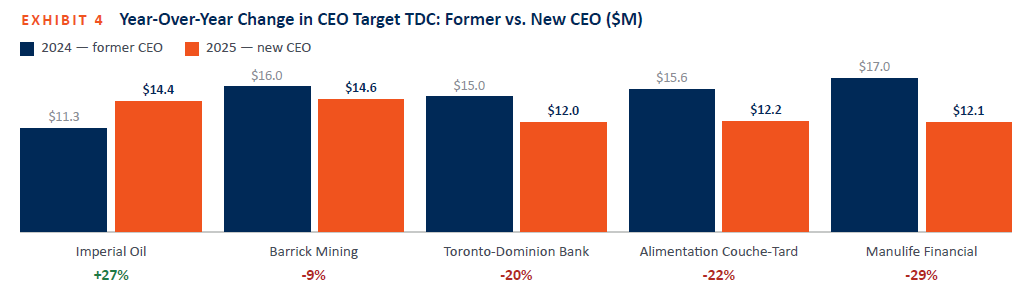
Five TSX60 companies transitioned CEOs during CY2025, all internal appointments. All appointees were first-time CEOs succeeding a longer-tenured incumbent, and target compensation was generally set 10 - 30% below the predecessor's level, consistent with our broader market experience. Imperial Oil was the exception, where the incoming CEO's target was set 27% above the predecessor's.
The company referenced strong business performance, leadership continuity following succession and competitive benchmarking considerations for the raise.
Incoming CEOs generally reach pay levels comparable to their predecessors within two to four years of appointment, based on a range of factors including corporate and individual performance.
Incentive Design Update
STIP Metric Weightings & Prevalence
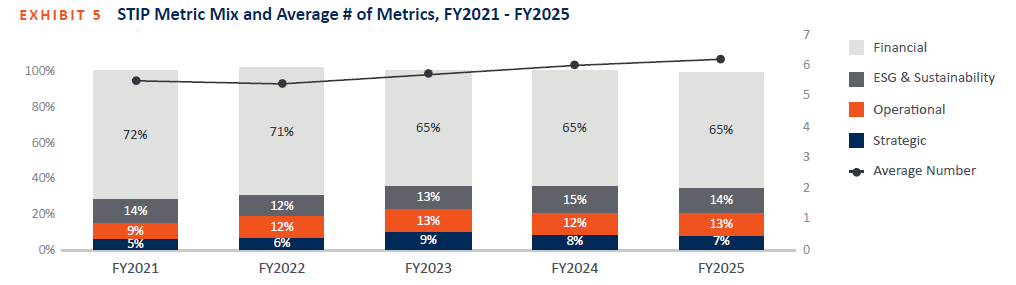
Financial metrics remain the most prevalent and highest-weighted measures, with 52 companies disclosing at least one. Where financial metrics are absent, STIP programs are generally entirely discretionary or disclosed in limited detail.
Since FY2021/22, the average weighting of financial metrics has been declining, with weight shifting toward strategic, operational, and sustainability objectives. Meanwhile the number of metrics has increased to 6.2 on average. Complementing quantitative measures with qualitative ones can reduce incentive volatility and give Boards greater ability to exercise judgement, particularly where targets are difficult to establish.
For qualitative measures to be effective, they must be supported by rigorous goal-setting, clear performance expectations, and disciplined evaluation, so outcomes remain transparent and aligned with shareholder interests.
Another approach to volatility is to widen performance shoulders so outcomes are appropriately calibrated to market conditions.
STIP ESG & Sustainability Metrics
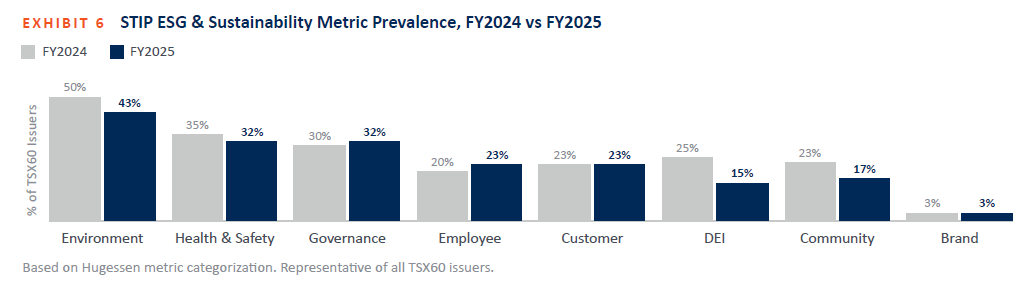
Usage of ESG and sustainability metrics in the STIP eased modestly, with 60% of TSX60 companies incorporating such measures in FY2025, down from 65% in FY2024. This decline appears driven partially by index constituent changes (the loss of Algonquin Power and Canadian Apartment Properties REIT) rather than active removal by continuing constituents.
Environmental metrics remain the most common category at 43% prevalence. DEI saw the sharpest single-year decline of any category, falling from 25% to 15%. Companies revising their DEI approach generally either reframed the related language or, less commonly, removed the metric outright, with changes concentrated among issuers with meaningful U.S. revenue exposure.
In our experience, while sustainability metrics and disclosure have been scaled back, the underlying culture and strategy elements largely remain in place.
STIP Scoring & Discretion
Short-term incentive programs generally paid out above target in 2025, with the average corporate score rising to 118%. In total, 34 companies achieved scores at or above target, up from 29 in the prior year. Performance was strongest in Energy, where robust demand drove an average corporate score of 154.8%.
The number of companies applying discretion held constant year-over-year. However, cases of downward discretion rose from 3 to 7, and most Boards disclosing formal adjustments (8 of 11) applied them to specific metrics rather than overall scores. Downward discretion was applied for reasons including M&A activity, safety incidents, and performance factors not captured in calculated results. Upward discretion was largely applied for macroeconomic factors outside management's control, such as tariff impacts.
While 11 companies disclosed the use of overall discretion, we expect the actual prevalence of more modest discretion within scorecards to be higher, for example, in the granular adjudication of individual performance factors at year end.

LTIP Instrument Mix
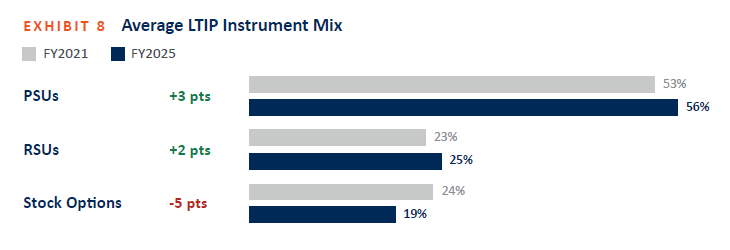
LTIP design in North America has been generally stable over recent years. PSUs continue to represent the largest component at approximately 56% of the average target mix, while stock option prevalence has gradually declined.
Despite that decline, options continue to represent a meaningful portion of LTI among the 33 TSX60 issuers that grant them, averaging 34% of target LTIP in FY2025. In Canada, options remain attractive from a cost-benefit standpoint, given potential gains relative to their accounting and disclosed grant date value. We expect LTI mix decisions to continue to be driven by company-specific factors such as pay philosophy, leverage, and retention objectives.
An emerging discussion is whether longer-dated incentives can achieve outcomes similar to traditional performance-based awards. Some U.S. investors and proxy advisors have begun to view five-year vesting RSUs as comparable to midterm performance awards such as PSUs, though this remains largely conceptual and has not gained the same traction in Canada. We will continue to monitor this over the next 12 - 18 months.
LTIP PSU Metrics
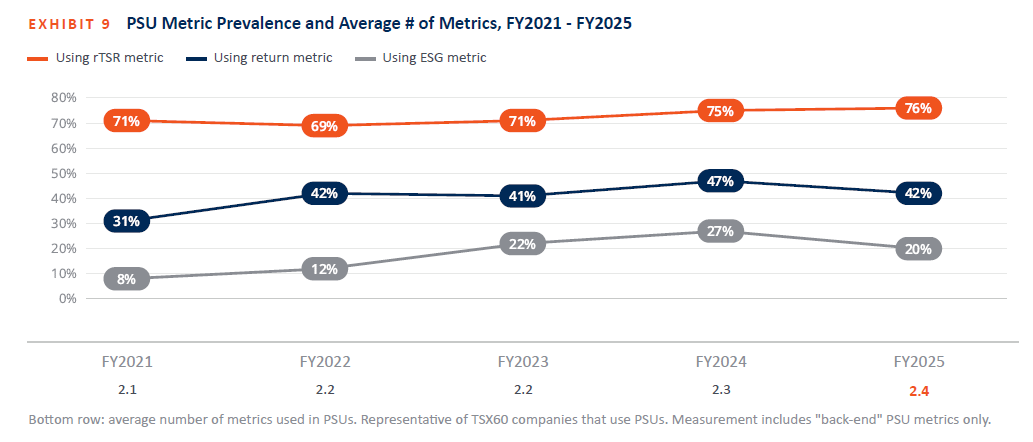
The average number of PSU metrics increased slightly year-over-year, to 2.4 from 2.3 in FY2024, continuing a trend toward more diversified performance scorecards. Relative TSR remains the most prevalent PSU metric, used at 76% of PSU-granting companies, reflecting continued preference for evaluating performance against peer share performance outcomes.
In an environment of strong financial markets but heightened economic uncertainty, rTSR may offer a pragmatic way to assess performance where establishing robust long-term financial targets is difficult. Beyond rTSR, return metrics (ROIC, ROE, ROCE) remain common.
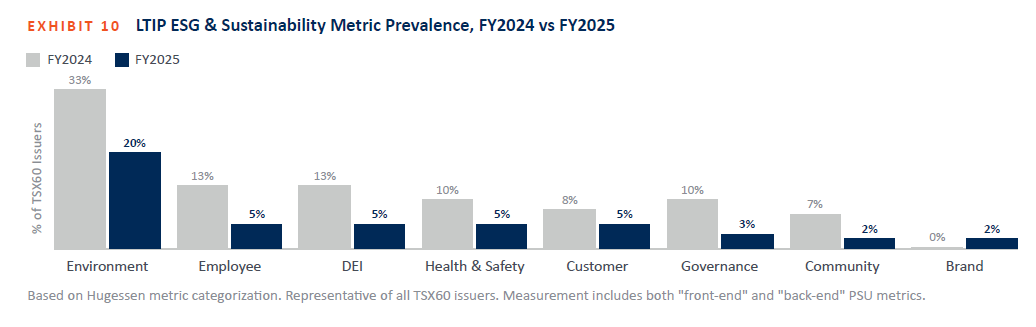
The use of ESG & sustainability metrics in the LTIP eased modestly, with 19 TSX60 companies incorporating such measures, down from 22 in FY2024. Part of the decline is attributable to index constituent changes; the remainder reflects a narrowing of measures as companies focus on fewer, high-priority areas rather than a reduced emphasis on sustainability. Environmental metrics remain the most common category, at 20% prevalence across all TSX60 issuers.
SAY-ON-PAY UPDATE
Strong Say-on-Pay results continue to be a notable theme in 2026. While investor voting rationales are not always transparent or consistently applied, the prevalence of strong corporate performance alongside rising support suggests shareholders generally view executive compensation outcomes as aligned with company performance and their own interests.
BOARD EFFECTIVENESS
Board Renewal
Board renewal in 2026 occurred at a rate consistent with long-term averages, at 8.6% versus 10.6% in 2025. The decline was driven primarily by fewer cases of significant renewal (meaning turnover of three or more directors), with 4 cases in 2026 against 8 in 2025. Boards experiencing significant renewal were CAE (39% turnover, strategic repositioning alongside CEO succession), Celestica (33% turnover, strategic repositioning and planned Board Chair succession), Hydro One (30% turnover, Board Chair succession and expanded Board), and Brookfield (19% turnover, Board expansion from 14 to 16 directors plus normal-course renewal).
Mandatory retirement policies remain prevalent, with 42% of issuers using age limits and 42% using term limits, while 38% have no retirement policy in place. Boards are increasingly assessing the "why" behind such policies rather than treating them as checklist items, focusing instead on strategic value-add and director performance to drive renewal.

Board Assessments
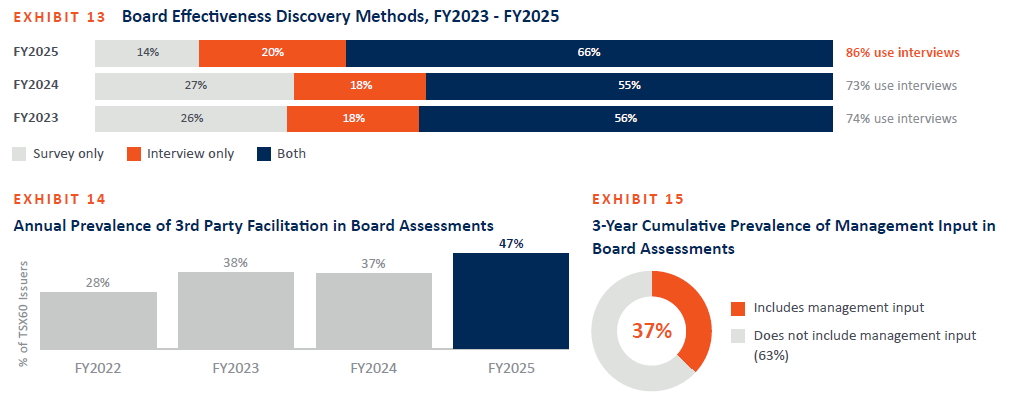
All TSX60 Boards disclosed conducting Board effectiveness reviews at some frequency in FY2025, with the majority doing so annually. Interviews in combination with surveys are the primary discovery method, and cumulative use of interviews rose 13 percentage points from FY2024 to FY2025, the largest year-over-year increase Hugessen has observed. This reflects growing emphasis on depth, nuance, and context, elements best captured through dialogue rather than a survey rating scale.
Nearly half of the TSX60 disclosed engaging a third-party provider to facilitate a Board effectiveness review, a 10 percentage point increase from FY2024. Roughly one-third have incorporated upward management feedback over the past three years. Together these reflect a shift toward more open and candid feedback, helping Boards identify blind spots, strengthen trust with executive teams, and ensure practical actions follow.
Conclusion
Canadian companies entered 2026 with momentum, against a backdrop of macroeconomic uncertainty, evolving trade dynamics, and sector-specific volatility. These conditions present opportunities for Boards to take a more strategic approach to incentive design, where diversified performance metrics, thoughtful discretion, and continued refinement of non-financial measures can support both short-term execution and long-term value creation.
The 2026 proxy season reflects measured evolution of compensation levels and incentive frameworks rather than structural change. Boards remain well positioned to refine their approach, reinforce pay-for-performance alignment, and support sustainable long-term growth.