Introduction
2016 was shaping up to be another challenging year for the TSX Composite following widespread declines across commodity sectors in 2015 (most notably in oil & gas). However, a recovery in underlying base metals prices due to increased Chinese demand, a rebound in oil prices due in part to a late-year pact among OPEC members to cut production, and a sharp rise in the price of gold amid geopolitical instability helped push the TSX Composite to its best year since 2009 (up 18% in 2016) and near all-time highs.
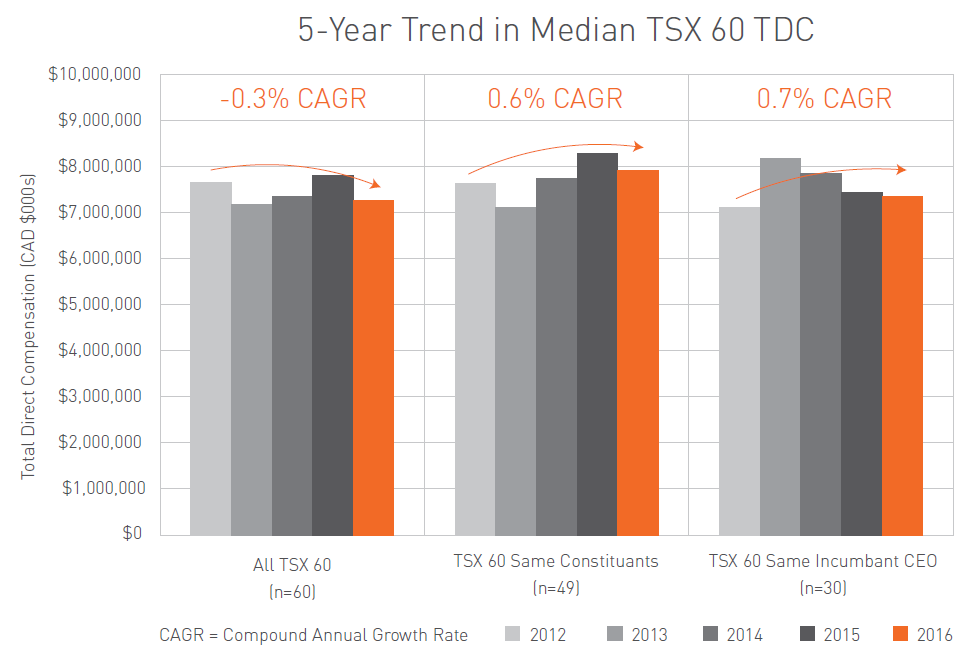
Amid a market rebound, median CEO total direct compensation ("TDC") levels among the TSX 60 decreased modestly by 2.0% year-over-year (y-o-y) to $7.4M[1]. The decrease was slightly less when measuring the same incumbents (excludes four CEO turnovers), down 0.9%. Meanwhile, TDC growth within commodity sectors (oil & gas and mining) turned positive, after a steep decline in 2015. Interestingly, the overall pay level trend within the TSX 60 has been relatively flat over the past five years, rising less than 1% annually even when measuring the same incumbents in the role over the period.
In terms of pay design trends, several issuers simplified their annual incentive frameworks by reducing the number of measures, and yet more companies introduced performance share units (PSUs) into their long-term incentive programs.
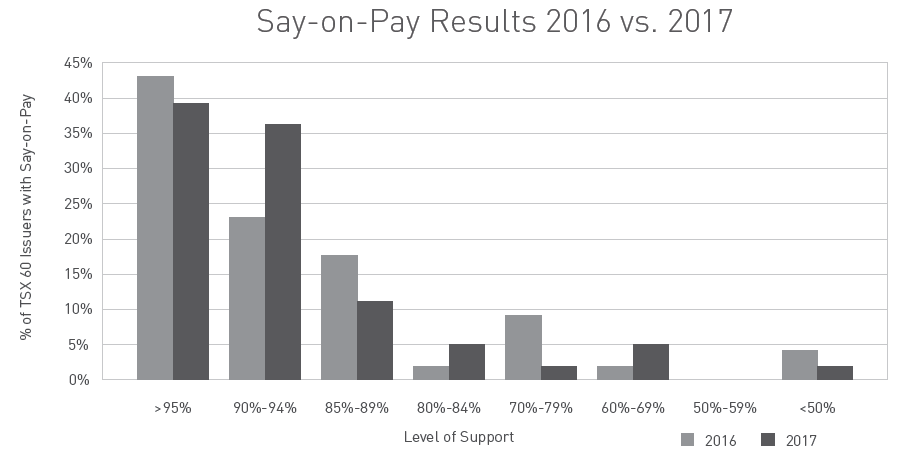
Say-on-pay support this proxy season remains strong among TSX 60 issuers (91% average support), with a few notable exceptions. Glass Lewis has taken a markedly less critical tone in 2017, recommending against only three TSX 60 companies versus 10 last year. ISS’ four against recommendations are in line with last year.
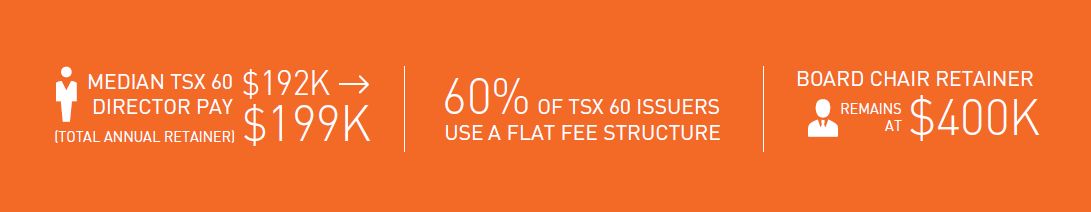
Our 2017 briefing has been expanded to include director pay practices among the TSX 60. The median total non-executive director annual retainer (including equity) increased 3.6% in 2016 to $199K and 60% of TSX 60 issuers now use a flat fee structure (no per-meeting fees).
As directors keep an eye on the impact of the new U.S. administration, particularly those with U.S. exposure, modifications to pay frameworks will continue to evolve as companies better understand their shareholders’ interests and evolving definitions of performance.
This briefing covers the following topics:
- TSX 60 CEO pay levels, mix and plan design
- Director pay levels
- Shareholder engagement
- Governance, regulations and disclosure
Pay Levels Update
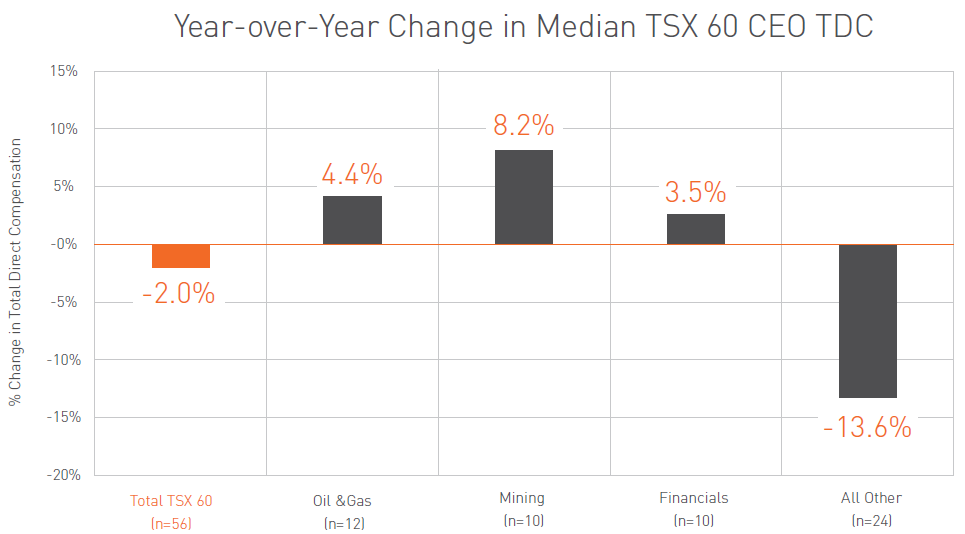
Among TSX 60 issuers, median TDC decreased by 2.0% in 2016 relative to 2015, after increasing 1.2% from 2014. The change for TSX 60 issuers with the same incumbent CEOs (n=52) was more modest, with median TDC decreasing 0.9% (looking at same incumbent CEOs eliminates some of the “noise” associated with CEO turnovers).
In a year that saw a considerable rebound in shareholder returns across most sectors, pay level decreases may be partly explained by:
- The modest appreciation of the Canadian dollar versus the US dollar over the course of 2016 having a moderating impact on pay levels for the one quarter of TSX 60 issuers who now pay their CEOs in USD
- Equity awards for most companies occurring in the first quarter of the year, which remained a challenging time from a market perspective, and were lower than historic levels for some sectors (e.g., energy)[2]
- The continued pressure on pay-for-performance alignment and rhetoric around appropriate CEO pay quantum (particularly in the commodities sectors) having an impact on the rate at which pay recovered / increased, despite a market rebound
Two sectors which experienced notable median pay decreases in 2015 given their tough market conditions (oil & gas and mining) saw modest rebounds in 2016. Median TDC rose 4.4% among the 12 TSX 60 Oil & Gas ("O&G") companies and 8.2% among the 10 TSX 60 miners. The most significant y-o-y increases were in annual bonus levels (determined in late 2016 / early 2017), rising 38.6% and 24.2%, respectively. We view this increase more so as a return towards market norms from depressed levels of the prior year, versus an actual increase to bonus quantum. Meanwhile, the sharp 13.6% decrease in “all other” industries (i.e. non-O&G, mining and financials) is largely a statistical anomaly of the median measurement (in fact, average TDC in this group increased by 4.6%).
Fewer TSX 60 companies transitioned CEOs in 2016 compared to the rate of turnover in prior years – only four versus 12 in 2015 (excludes George Weston). Canadian Tire recorded a material increase to CEO pay y-o-y due to a sizable one-time equity award (and the return of a former CEO), while CN Rail, Goldcorp and Husky all decreased pay markedly versus the previous CEO, consistent with multi-year trends observed.
The longer-term trend in CEO pay paints an interesting picture, as TSX 60 pay levels have remained relatively flat since 2012[3].
Pay Design Update
Overall, the disclosed changes to short-term incentive plan (STIP) design consisted of relatively minor tweaks to metric weightings, with only a handful of TSX 60 issuers undertaking larger structural changes:
- Several issuers made notable cutbacks to the number of STIP scorecard metrics (e.g., CIBC from six to three; Crescent Point seven to three; Manulife seven to four)
- Others increased the formal amount of discretion available to the Board / Compensation Committee (e.g., Sun Life added a +/- 20% discretionary modifier for 2017)
- The pressure to strike the right balance of performance measures was echoed in conversations we had in December 2016 with select Canadian and U.S. institutional shareholders
The increased emphasis on performance conditioned long-term incentive programs (LTIP) continued in 2016 with several TSX 60 issuers (Shaw, Magna, Agnico Eagle and Potash Corp of Saskatchewan) introducing Performance Share Units (PSUs) for the first time. On average, PSUs continue to represent approximately half of the CEO LTIP mix, with stock options and RSUs accounting for the remainder at 35% and 15%, respectively.
Director Compensation Update
2017 marks the first year this briefing includes commentary on director compensation levels among the TSX 60. The median total non-executive director annual retainer (including equity) increased 3.6% in 2016 relative to 2015 to approximately $199K, while the median Board Chair total retainer remained flat at $400K[4]. Nearly 60% of TSX 60 issuers now use a flat fee structure (do not pay meeting fees), with Sun Life and TransCanada making the switch in 2016.
The impact of currency fluctuations on director pay design continued into 2016, as more companies (e.g., Pembina) adopted a policy of paying their directors the same nominal dollars (i.e., U.S.-based directors receive the same amount as their Canadian colleagues, but in USD) or changed their fees for all directors to USD (e.g., Gildan). Interestingly, for 2017, Cameco is taking the opposite approach, switching their policy from USD payment to CAD payment for all directors.
Say-on-Pay (SoP) Update
2017 results are shaping up to be in line with recent years, in terms of both average support levels and the occurrence of several high-profile failures
- Average SoP support among the 44 TSX 60 issuers who have held their annual meetings as at May 30 is 91%, up 1% from the 2016 proxy season
- Although the percentage of firms attaining a >90% result increased y-o-y, interestingly, those with >95% votes dropped
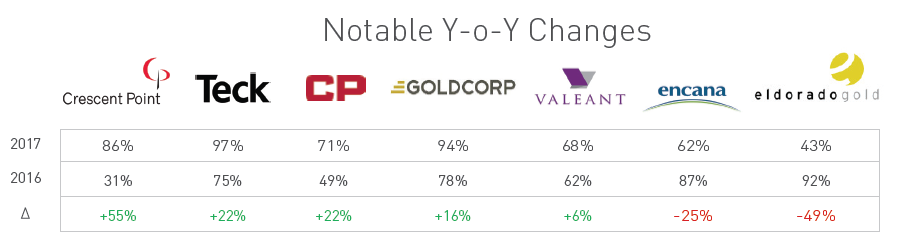
- There have been two failures (i.e. <50%) in Canada so far (Eldorado Gold and TransAlta) and two TSX 60 issuers with results below 70% (Valeant and EnCana)
- The results of the two TSX 60 issuers who failed in 2016 improved this year (Canadian Pacific 71% vs. 49% and Crescent Point 31% vs. 86%)
Proxy Advisor Update
The proxy advisory firms, Institutional Shareholder Services (ISS) and Glass Lewis, continue to influence SoP voting and broader governance discourse in 2017. As of May 30, ISS has recommended against four SoP votes among the TSX 60, in line with last year. Meanwhile, Glass Lewis has scaled back their criticism from 2016 levels, recommending against only three TSX 60 issuers, versus 10 in 2016.
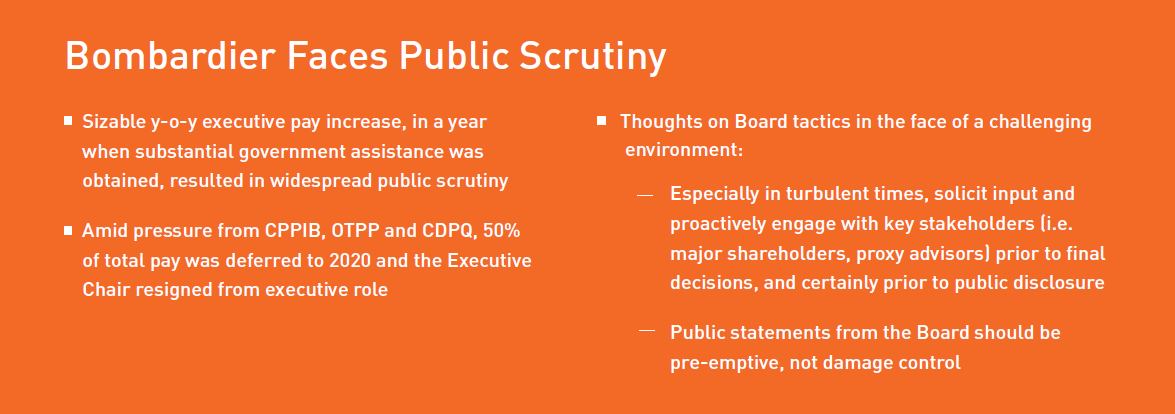
- The distinct pay-for-performance methodologies used by ISS and Glass Lewis continue to result in contradictory voting recommendations for some companies (e.g., Canadian Pacific, Eldorado, Bombardier)
- On average, the five TSX 60 issuers who received negative SoP recommendations from one or both proxy advisors received 68% SoP support in 2017 (versus 72% in 2016)
- Glass Lewis introduced its Environmental, Social and Governance Profile (ESG) which assesses an issuer's ESG performance versus its peers and highlights any noteworthy controversies
Shareholder Engagement Update
Direct engagement by independent directors with major institutional shareholders and proxy advisors has increased over the past decade as issuers become more comfortable with, and recognize the value of, “telling the story” of executive pay and other strategic and governance decisions. According to our Fall 2016 Director Opinion Survey, the prevalence of existing or planned engagement among directors of large-cap (>$5B) Canadian public issuers surveyed was nearly 75%.
A growing number of TSX 60 issuers, now nearly one third, are voluntarily disclosing details of the shareholder engagement activities undertaken in the year past, as well as the adoption of formal engagement programs occurring on an annual basis (almost 50% of issuers) – actual prevalence may be higher.
Some of the more extensive engagement campaigns were undertaken by issuers who received poor SoP support in 2016, including Canadian Pacific, who met with shareholder advocacy groups, ISS & Glass Lewis, and 16 of its largest institutional shareholders, and Crescent Point, whose Compensation Committee Chair directly met with proxy advisors and shareholders representing 30% of common shares.
Regulatory and Disclosure Update
As public issuers in the U.S. prepare for the expected implementation of the CEO pay ratio in 2018, regulatory activity in Canada has been relatively quiet. Several material changes to disclosure requirements proposed by the TSX in 2016 were scaled back in April 2017 following public comment.
Proxy disclosure continues to evolve as shareholders and proxy advisors increase expectations for the clarity and comprehensiveness of disclosure. Supplemental ‘realized / realizable’ pay analyses remain popular and 24 TSX 60 issuers now disclose Board diversity policies with formal quotas, up seven from 2016.
Conclusion
As Canadian companies balance the prospects of rosier domestic and international outlooks with volatile political discourse south of the border, executive pay continues to evolve with shifting shareholder interests and definitions of success. Meanwhile, the widely-held notion that executive pay levels continue to ratchet higher is somewhat dispelled by minimal change in the median pay levels over the past five years.
As most Boards wrap up their annual decision-making process and reflect on the outcomes of their annual general meeting, they should have a better understanding of how shareholders apply a critical eye in their evaluation of Board oversight responsibilities. We anticipate the relationship between pay and performance (particularly longer-term performance) and the simplification of pay frameworks will remain the focus of incentive plan design in 2017.
Lastly, we have witnessed further examples of how expanded focus on direct, proactive engagement with shareholders in advance of major program changes or in the face of a tough performance environment can result in successful support of a company’s approach towards executive pay. Conversely, the failure to do so, or the appearance of being insensitive to shareholder priorities, can easily catch not only shareholders’ ire, but the public’s as well.
[1] As at May 30, 2017, data is not available for Saputo and Alimentation Couche-Tard. Data was excluded for Valeant and Constellation due to irregular pay practices. Total cash compensation (TCC) = base salary + annual bonus; Total direct compensation (TDC) = total cash compensation + long-term incentives
[2]Note that our analysis captures the grant date fair value of equity awards per the summary compensation table, which can be significantly different from a CEO’s realized / realizable compensation
[3] “All TSX 60” includes all index constituents, excluding Saputo and Alimentation Couche-Tard in 2016. “Same Constituents” includes only those companies consistently in the TSX 60 from 2012 - 2016. “Same Incumbent” includes only those TSX 60 companies in the index, and with the same CEO from 2012 - 2016
[4] As at May 30, 2017, data is not available for Saputo and Alimentation Couche-Tard