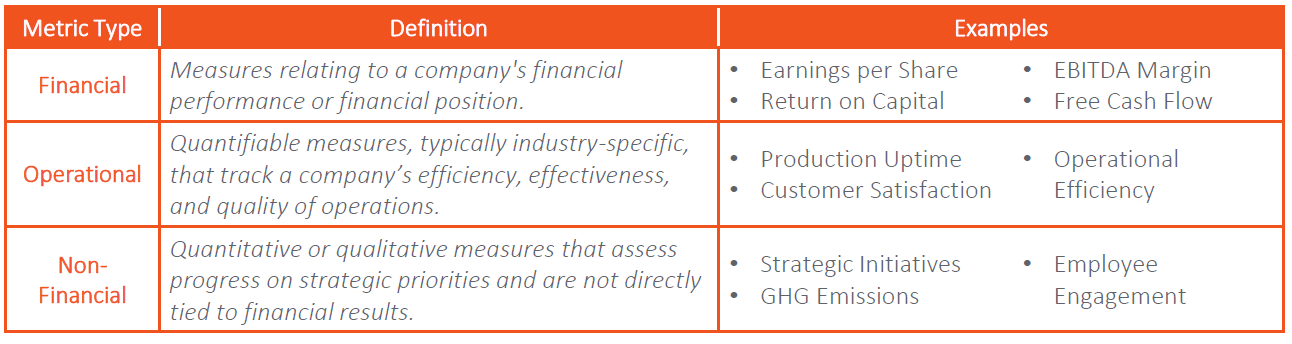
The use of non-financial metrics has become a common fixture in executive incentive programs as they are often seen as critical drivers of business performance. Metrics such as sustainability, employee engagement, and strategy commonly complement traditional financial and operational measures in the annual corporate scorecard, and at times in the long-term incentive program. On the surface, this appears to be progress: broader measures of corporate performance providing a more nuanced linkage between pay and performance. But a closer look raises an important question: are non-financial metrics truly at-risk and subject to business outcomes, or do they inflate bonuses and insulate executives from underperformance?
To explore this question, Hugessen has conducted a systematic review of short-term incentive plan (STIP) scores across companies in the TSX60 over the last three years. Our goal was to understand how non-financial metrics are scored relative to financial and operational metrics, and whether there is a discernable pattern in their impact on bonus payouts. This article, focused on STIP scores, is part one of a two-part series on incentive plan scores. The next part will explore long-term incentive plan (LTIP) scores.
Research and Methodology
We examined the scores assigned to metrics in each category, expressed as a percentage of target, with 100% representing target achievement. Most companies reported payouts ranging between 0% to 200% of target. Where applicable, we also analyzed the individual metric score assigned by the board of directors to the CEO. Companies that do not utilize a scorecard to determine annual bonuses were excluded from the dataset.
Key Findings: Financial, Non-Financial, and CEO Individual Metrics
Financial Metrics
Companies scored financial metrics across a wide range of outcomes, with 108% being the median score.

Non-Financial Metrics
Non-financial metrics were very often scored above-target, with 114% being the median. There was a high concentration of scores in the “at or just above target” range of 100–110%. Among companies using both financial and non-financial metrics, non-financial metrics scored, on average, 6% higher than financial metrics.

CEO Individual Metrics
We also gathered the CEO’s individual performance score, which can be used as a weighted metric or modifier in the CEO’s annual bonus. Our findings revealed an upward skew in CEO-specific scores, thus raising the question of whether CEO efforts may be over-rewarded relative to company results.

Distribution of Payout Scores by Metric Type
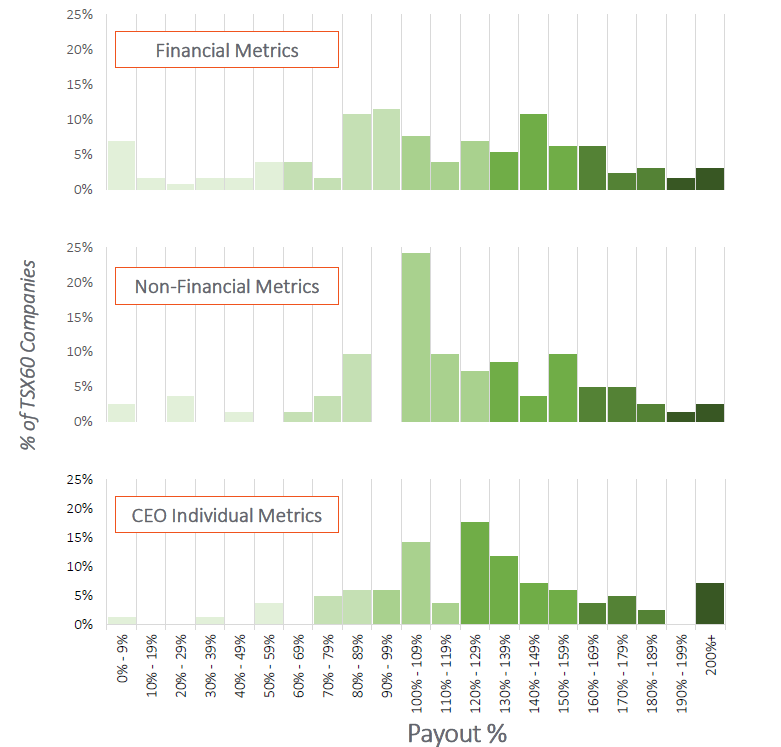
Financial metric scores saw a wide range in outcomes, reflecting true variability in performance. In contrast, non-financial metric scores were less variable and tended to be scored higher than financial metrics. While in some cases this may reflect genuine overperformance, this pattern also provides evidence to a more skeptical view that non-financial metrics are systematically easier to achieve.
Practical Takeaways
Choice of Non-Financial Measures
Unlike financial metrics, which are typically grounded in established accounting standards, non-financial metrics can lack universally accepted definitions. Companies need to ensure that these metrics are consistently measured, reliable, and meaningfully linked to corporate performance. Without such rigor, pay-for-performance credibility can be undermined. Regularly reviewing non-financial metrics, including their definition, measurement approach, and scoring methodology, can ensure alignment with corporate strategy.
Goal Setting and Performance Assessment
The structure of non-financial metrics can range from quantifiable goals to subjective evaluations of strategic progress. Discipline in defining what constitutes success and adhering to that standard when evaluating performance at year-end is critical. Ensuring alignment and robust processes between the compensation committee and management, and maintaining ongoing dialogue throughout the fiscal year can help prevent surprises at year-end.
Balance
Incentive programs should weigh financial and non-financial metrics appropriately, reflecting their relative contribution to the evaluation of corporate performance. Overweighting non-financial measures, particularly when the performance assessment process is weak, can reduce the rigor of the incentive program. A financial performance “gate” can be used to reduce the risk of misalignment, which would cap non-financial metric scores when financial performance falls below a certain threshold.
Disclosure
Shareholders and other stakeholders expect clear disclosure of non-financial metrics, how they are assessed, and how they connect to strategic outcomes. Ensuring clarity in both design and communication reinforces credibility of the executive incentive program.
Conclusion
Non-financial metrics can be beneficial in providing a broader view of corporate performance when used in executive incentive programs. They can also provide latitude for compensation committees to apply a subjective evaluation of performance to arrive at the “right” incentive outcome, and in some cases, provide stability to the annual bonus. Their effectiveness, however, is predicated on the rigor in how they are designed, thoughtfulness in how goals are set, and discipline in how they are assessed.
As we approach the year-end compensation cycle, now is the time for compensation committees and management teams to think about the corporate scorecard for the year ahead. Are non-financial metrics genuinely stretching performance, or are they inadvertently creating lay-ups? A principled approach will ensure that incentive programs remain credible, are performance-aligned, and deliver the right outcomes.