Introduction
On March 4th, 2023, Silicon Valley Bank Financial Group (SVB) released its proxy circular for fiscal year 2022. Within weeks of the release, the financial institution would collapse, forcing the Federal Deposit Insurance Corporation (FDIC) to step in to ensure depositors’ access to funds, and to limit widespread panic within the U.S. banking sector.
Although SVB experienced strong financial performance and rapid growth in 2021, 2022 marked a strong reversal with SVB’s share price falling by 66% from $682 to $224 YoY. Despite this material decline in share price, the CEO’s total compensation remained relatively flat year-over-year (i.e., $9.9 million), according to the Company’s 2022 Summary Compensation Table (SCT) figures. Further, the new SEC requirements on “Pay Versus Performance” (PVP) disclosure demonstrated a net loss of realizable compensation to the CEO of ~$27M as of December 31, 2022.
The abrupt and complete collapse of SVB provides a potent case with which to examine the utility of the various components of executive pay disclosure. This article aims to help readers reconcile these vastly different truths. Although the SCT and PVP disclosure seem to contradict, they are in fact complimentary pieces of information that provide stakeholders with a valuable perspective on the company’s approach to executive pay.
Performance Context
SVB’s core client base operates primarily in VC-backed and technology companies. With the surge of venture capital investment and equity raises in 2020 and 2021, SVB’s deposit base rose dramatically. The Q4 deposits in 2020, 2021 and 2022 were $93B, $183B and $175B, respectively.
The deposit surge reached over $190B in Q2 2022 before falling back to $175B at year end, with a more significant decline in non-interest-bearing loans. By the end of February 2023, deposits were $169B.
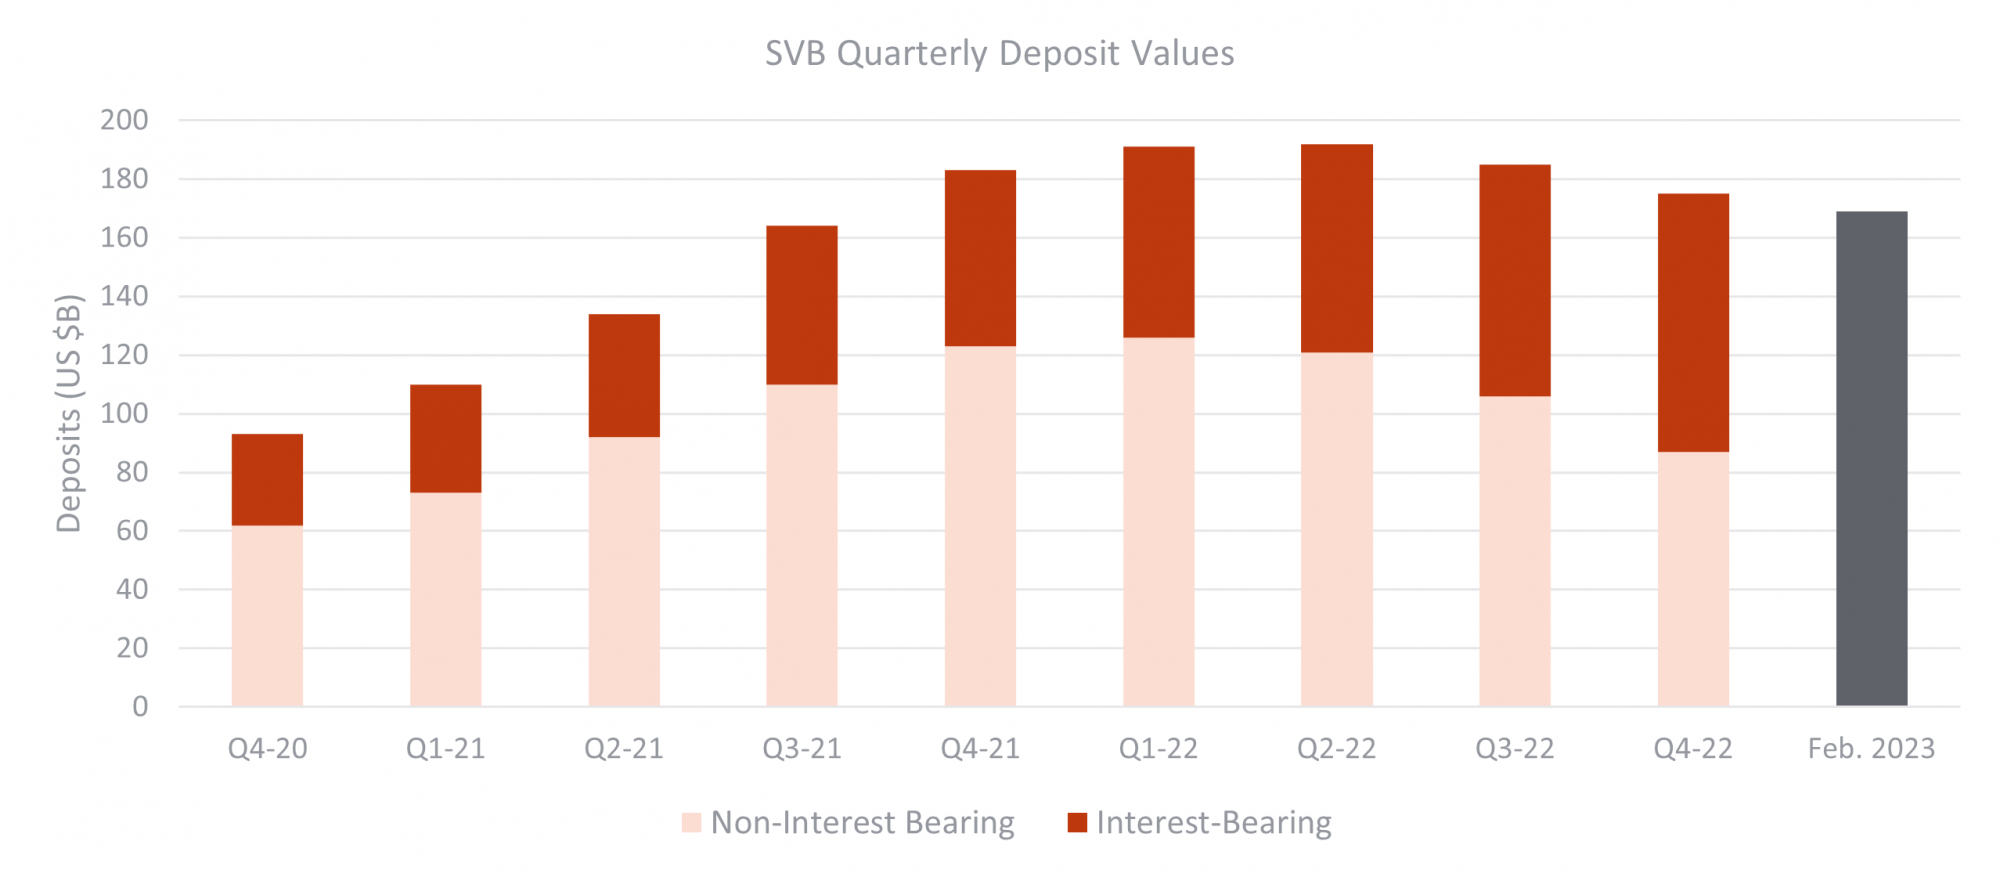
Source: Company Investor Presentations
On the flip side of the asset/liability ledger are loans and investment securities; the returns from which generate net interest margins. As of February 2023, SVB’s loan balance was ~$70B, reflecting a relatively low loan-to-deposit ratio, well below 50%. The Company’s investment securities were in the order of $120B, largely made up of U.S. government or government-related debt.
From a credit quality perspective, this appears to be a strong balance sheet. However, a large portion of these investments were long-term with fixed interest rates; over $90B were classified as HTM (held-to-maturity) and less than $30B were classified as AFS (available-for-sale). HTM securities market values are highly sensitive to interest rate changes. To give a sense of scale, a general rule of thumb is that a 1% increase in interest rate will diminish the saleable value of a bond by a percentage roughly equal to the bond’s average duration, in years. However, unless sold or reclassified, HTM securities do not need to be marked down during periods of rising interest rates, from an accounting perspective. The interest rate fluctuation only affects the HTM value if it is sold prior to maturity.
In the context of increasing interest rates, SVB’s deposit decline began in 2022 and accelerated in early 2023. The rapid change in the value of deposits was primarily driven by the cash burn faced by the Bank’s relatively homogeneous client base (i.e., negative cash flows and decreasing venture capital), and by the desire of some clients to take advantage of higher yields available for idle cash. In early March 2023, the Company provided shareholders with a presentation entitled - Strategic Actions/Q1’23 Mid-Quarter Update. SVB sold ~$21B of AFS securities to gain liquidity (note: this resulted in a transaction loss of $1.8B, which would otherwise have been reflected in the mark-to-market accounting whether the assets were sold or held. This may have provided indications of whether the HTM securities needed to be sold). Management also disclosed their intention to raise $1.75B in equity capital.
Shortly after, SVB’s stability quickly unravelled. Beyond high levels of cash burn and the search for higher yields, panic developed over the large portion of deposits that were uninsured. While there are differing perspectives on the driving forces behind the speed of the deposit withdrawals, the rapid dissemination of live information through social media, common VC and PE sponsor advice, and the ease with which money can be moved through web transactions were all likely contributors.
Summary Compensation Table & Pay-vs-Performance Disclosure
Silicon Valley Bank PVP Disclosure
The 2023 proxy season marks the first year where U.S. issuers (i.e., issuers under SEC regulation) must provide some disclosure on how executive pay aligns with corporate performance over the five most recent fiscal years (for further background on the new SEC rule, see the Hugessen’s article “SEC Adopts Final Rules on Disclosure of Pay vs Performance”).
The PVP disclosure focuses on “Compensation Actually Paid” during the fiscal year, which is somewhat misleading. In reality, the disclosure captures the change in the economic value of an executive’s compensation over the course of the year. In comparison, the SCT disclosure provides the estimated fair value of the equity compensation based on the expected performance at the date of grant (i.e., intended award value for expected/target performance).
As they are typically paid in cash, the compensation values tied to base salary, annual bonus (or “non-equity incentive plan compensation”) and “other” components of compensation will not differ significantly between the SCT’s Total Compensation and the PVP’s Compensation Actually Paid values. On the other hand, the equity (“stock awards” and “stock option awards”) and pension compensation values will likely differ meaningfully between the SCT and the PVP tables.
To further complicate things, many companies have and continue to voluntarily include their own approach on realized/realizable pay by throwing a third compensation value into the disclosure mix.
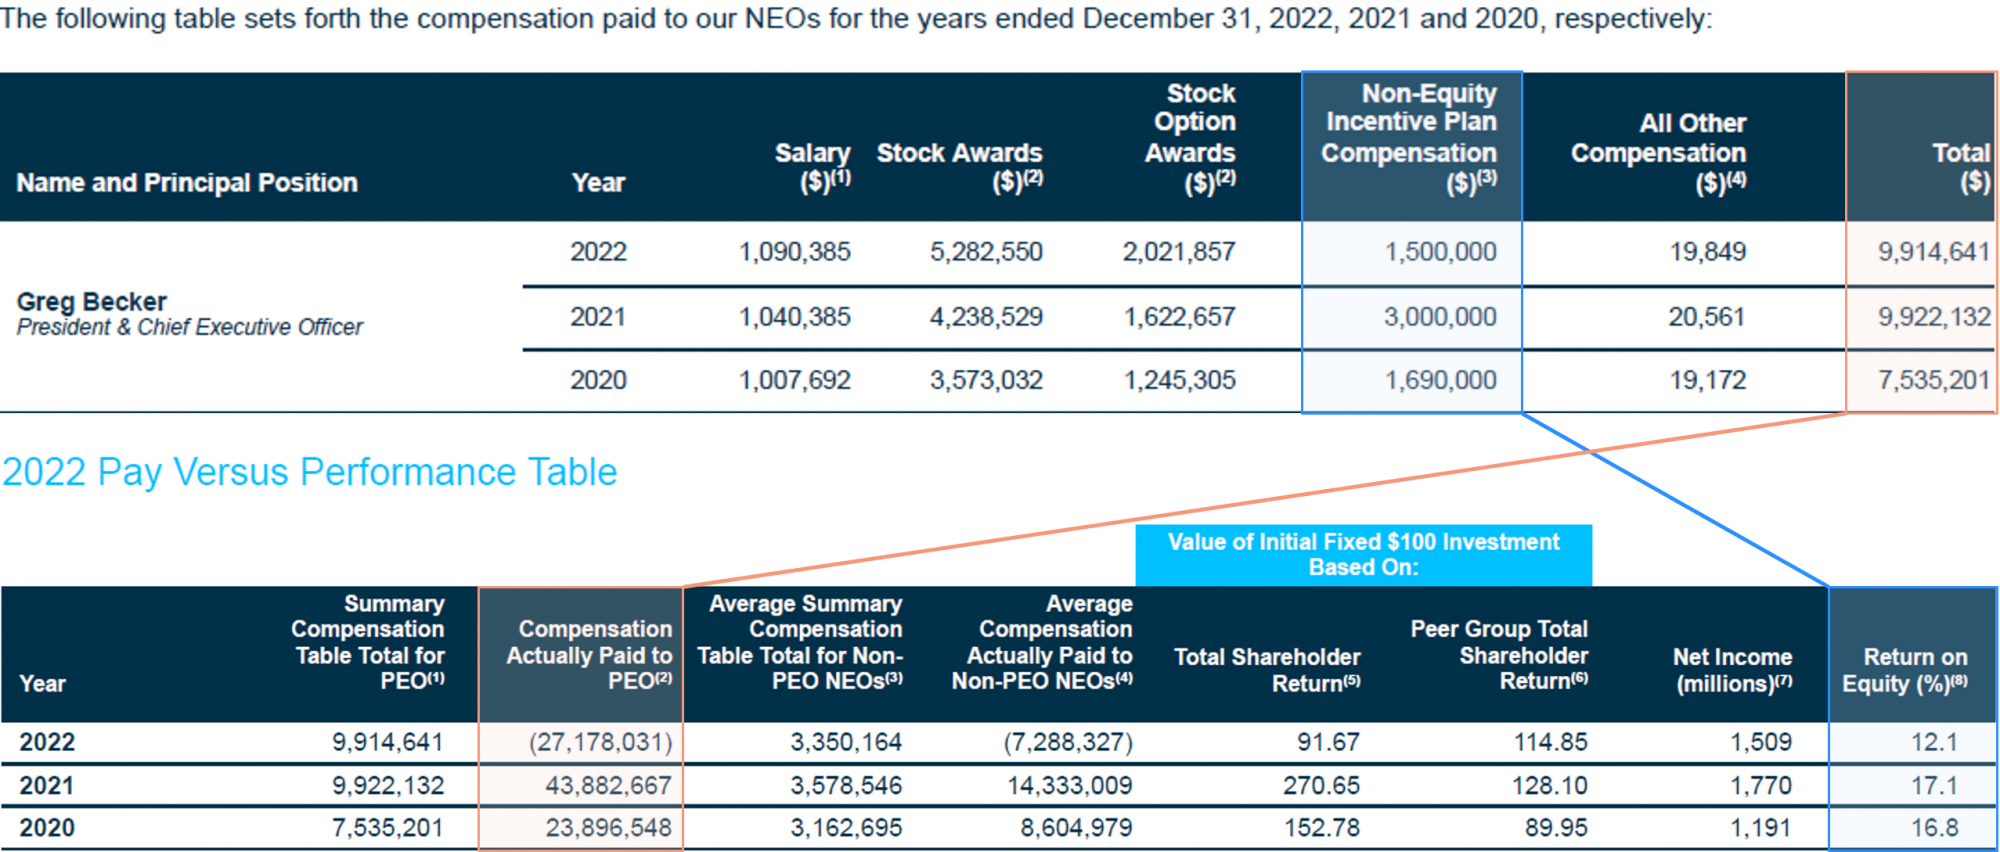
Excerpts of SVB’s 2023 Proxy Circular below show the extreme differences between the SCT and PVP table values.
The tables below illustrate the material fluctuation in the CEO’s “actual” compensation over recent years as SVB's stock price increased by ~75% in 2021, and subsequently fell by ~66% in 2022.
Further, the disclosure also highlights how the year-over-year changes in the CEO’s annual bonus payment were heavily driven by SVB’s Return on Equity (ROE) performance.
Given the fact that equity awards typically account for the largest portion of an executive’s compensation package (e.g., at SVB, equity awards accounted for 71% of the CEO’s target pay mix in FY2022), and the fact that equity awards are annually revalued within the PVP disclosure, we observe material differences between the compensation values characterized as PVP Actually Paid, and the figures in the SCT. In theory, the actual value of equity awards fluctuates with both the share price and with any applicable vesting performance conditions. As such, equity awards are intended to promote alignment with the shareholder experience.
While the SCT provides a glance at the intended compensation levels, the PVP disclosure may provide a more accurate picture of the current value to the executive, and how this relates to the shareholder experience and/or to the key financial metrics used by the company. The chart below illustrates SVB CEO’s historical total compensation over the last 3 fiscal years, highlighting both the SCT and PVP values, and overlaying the performance of key financial indicators (i.e., TSR and ROE).
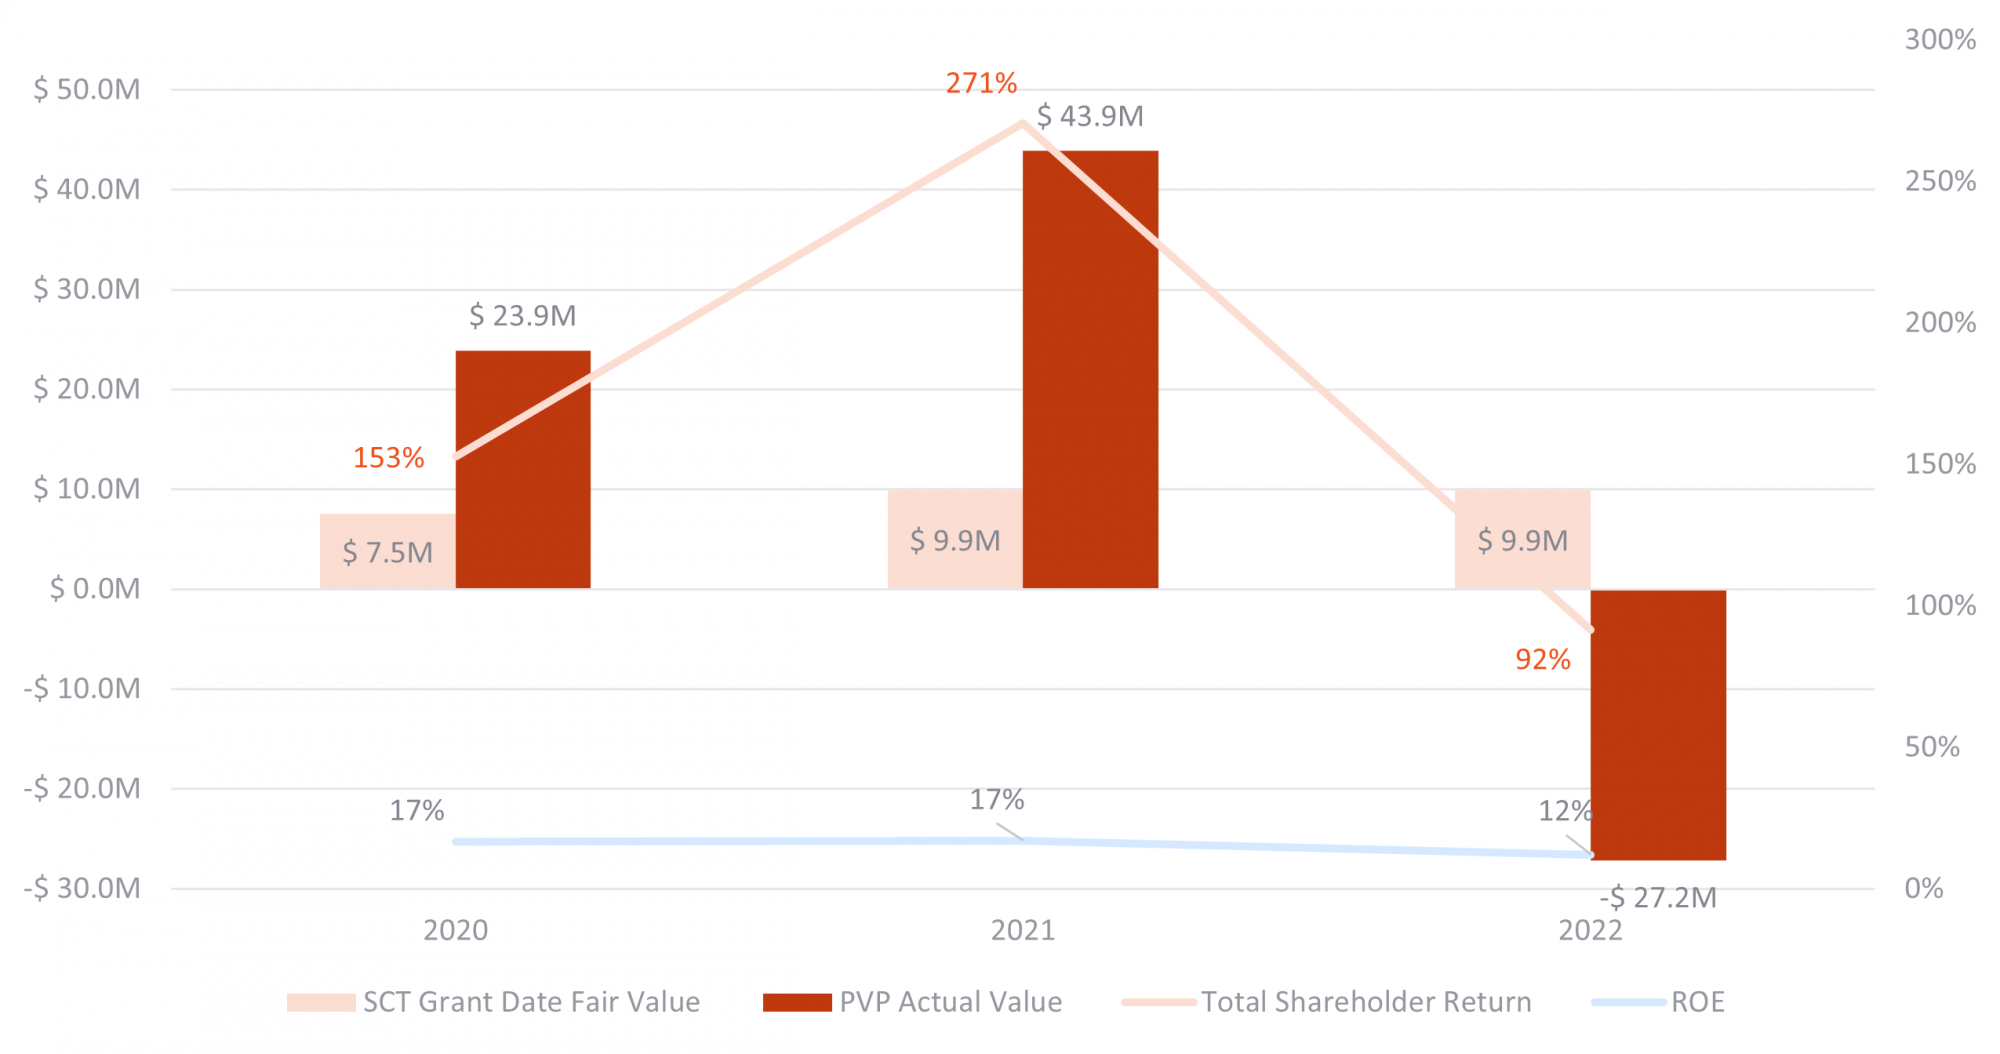
Source: Company Proxy Data | S&P Capital IQ
Major U.S. Banks Pay-vs-Performance Disclosure
While year-to-year fluctuations in equity compensation values are to be expected, SVB is an extreme example. As a juxtaposition, the following table shows the SCT total compensation values, and the PVP Actually Paid values for the CEOs of the major U.S. banks. Over time, in an expansionary economy, we expect to see the PVP values exceed the SCT values as share price appreciation increases the actual value of the equity awards.
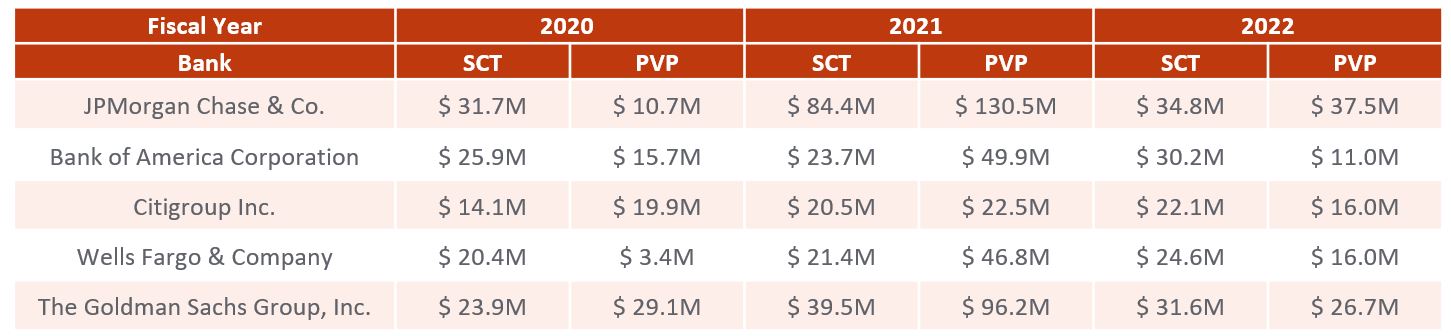
Source: Company Proxy Data
Note: as shares are priced to increase in value, over time, the PVP should be higher than the SCT.
Assessing Performance
In FY2022, 100% of SVB’s corporate STIP score was based on ROE (2/3 absolute and 1/3 relative to peers), with an undisclosed portion based on individual performance factors. Relative ROE was also used to determine 50% of the PSU performance multiplier. The Company’s CD&A states, “ROE is the most appropriate indicator of… financial performance as it demonstrates how efficiently the Company is using capital invested by shareholders to generate profit.”
In arriving at the CEO’s FY2022 bonus pay-out, the following factors were considered:
- The corporate score of 92% was not adjusted (FY2021 corporate score was 178%)
- Individual scores appear to have been adjusted downward; CEO’s annual bonus was paid out at 68% of target (as compared to 190% in FY2021)
- As outlined in the CD&A “[pay-outs] took into consideration… market challenges that impacted [performance], including balance sheet pressures and declines in stock price performance”
A downward adjustment of 24% on the CEO’s bonus payout feels like a material impact. So how did his Total Compensation in the SCT remain flat year-over-year despite a 2022 bonus award that was 32% below target and nearly half that of his 2021 bonus award? Two drivers come into play. The first was an increase in target pay from $7.9M to $11.3M, and the second was a shift in pay mix that increased his long-term incentive from 67% to 71%.
Conclusion
In a world where shareholders and proxy advisors are highly focused on the alignment of pay and performance, the new PVP disclosure provides another lens with which to assess the effectiveness of the pay program over the long run. However, even with the overlay of TSR, Net Income, and ROE (the metric of the company’s choosing) it is a blunt tool that tells only a piece of the pay and performance story.
The importance of the SCT and CD&A with its breakdown of pay components, written narrative on how incentive grants are determined, and the voice of the Board on how performance impacted incentive awards in Letters to Shareholders will continue to carry the day. While many companies are likely to keep these two disclosure tables separate, the best will find a way to knit together the narratives.