In the same way that performance among companies in the TSX 60 Index1 (“TSX 60”) is considered a bellwether of the overall Canadian economy, the compensation and governance practices of the TSX 60 provide an important frame of reference for Canadian companies generally. Since the end of the most recent Canadian proxy season, Hugessen Consulting has compiled data on the executive compensation practices at TSX 60 companies, with the aim of uncovering recent trends in pay levels and design.
This document provides a glimpse into some of the high-level findings from this review.
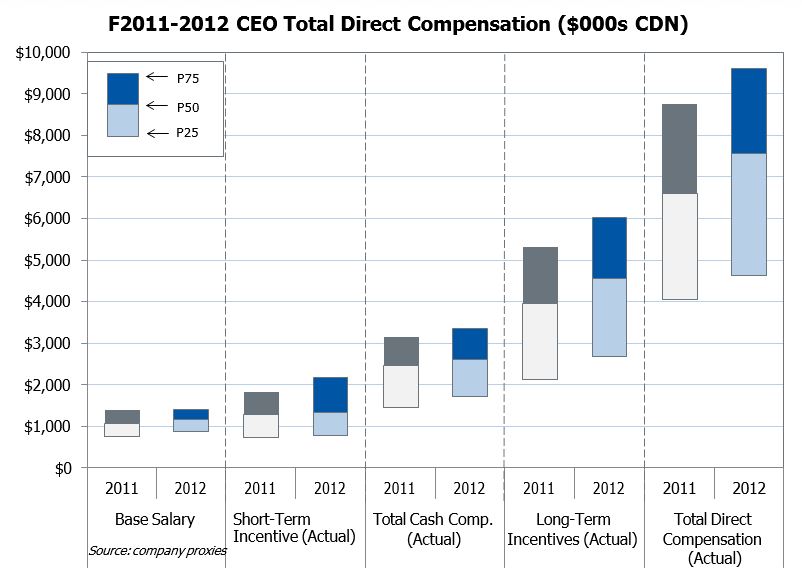
Actual CEO Pay Levels Increased Year-over-Year
- For the companies that currently make up the TSX 60, median actual Total Direct Compensation2 (“TDC”) in 2012 was $7.5 million, ranging from a low of $2.9M (First Quantum Minerals) to a high of $16.4M (Magna International)
- This represents an increase of 14.4% above the 2011 median, and includes companies where a change in CEO (n=18) occurred between 2011 and 2012
- For same incumbent CEOs (n=42), median TDC increased by 4.5% between 2011 and 2012
In comparison, the median 2012 CEO TDC for the S&P 500 was $9.3 million3
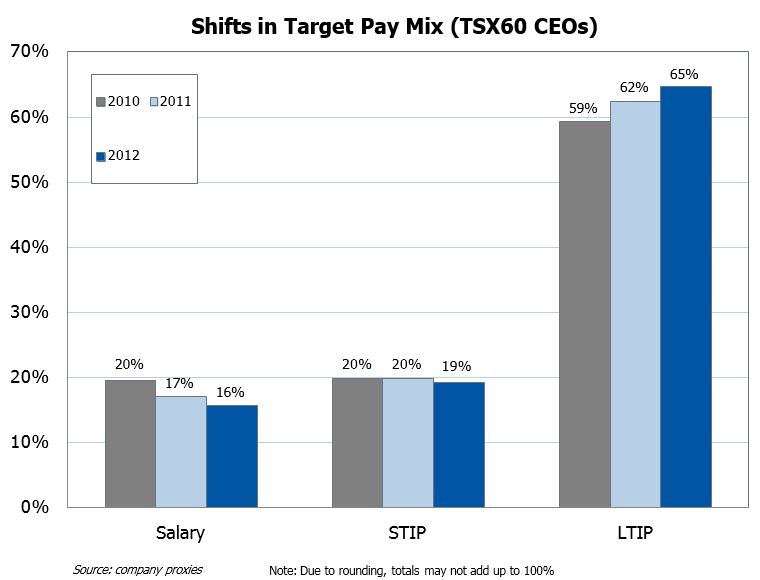
Long-Term Awards Make Up Larger Portion of Target CEO Pay
- 2012 saw a continued shift in target pay mix, with LTIP accounting for a larger percentage of target CEO pay than in previous years, at the expense of base salary
Increased Use of Multiple LTIP Instruments
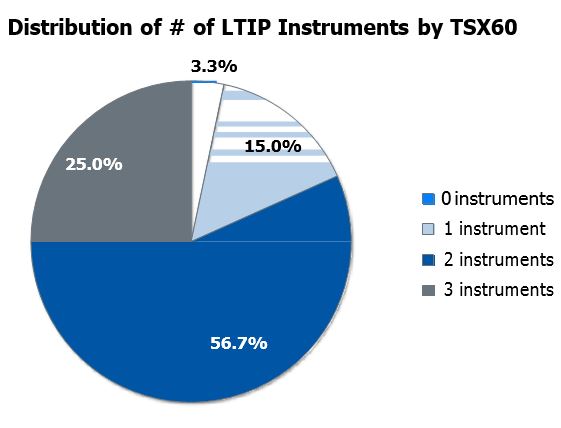
- The vast majority of TSX 60 companies (82%) grant at least two types of LTIP instruments to CEOs, an increase from 2011, when 75% of companies granted at least two LTIP instruments
- Among those that use two LTIP instruments, the most common combination of instruments used were options and performance share units (PSUs)
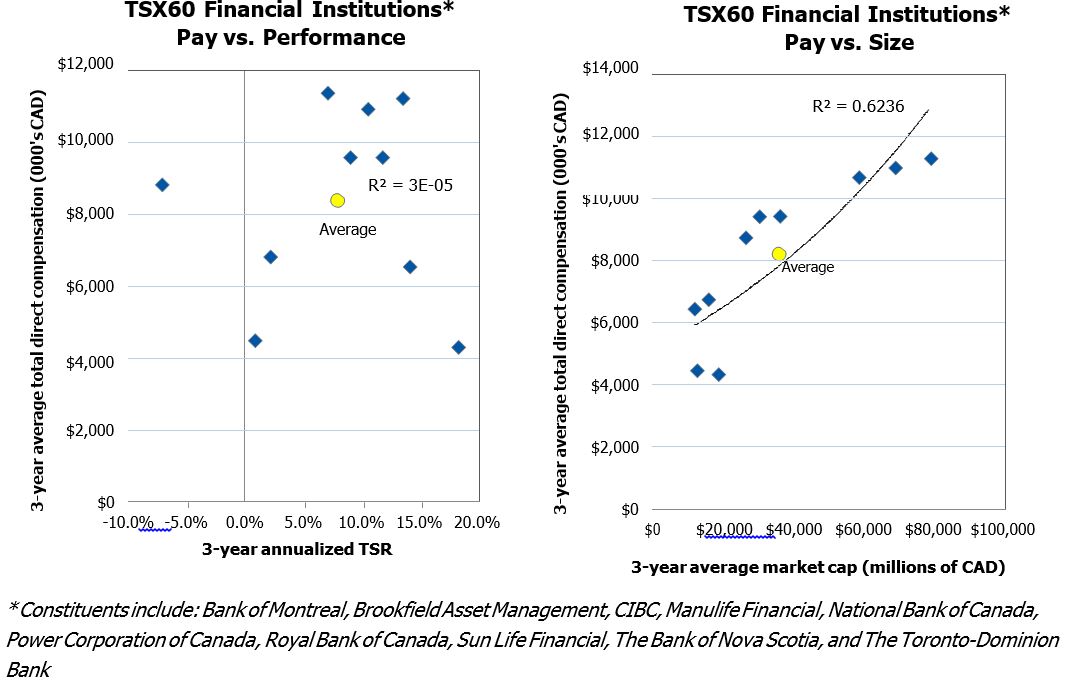
Size Remains Better Predicter of Pay Than Performance
- Generally speaking, during the past three years, the correlation between CEO TDC and company size (i.e. market cap) has been greater than between CEO TDC and performance (i.e. total shareholder return)
- We have observed that this trend is more apparent in some industries, such as Financial Institutions (as shown below) and mining, than in others
- While this trend is interesting, it is important to note that the largest portion of TDC typically consists of the grant-date value of long-term incentive grants, the majority of which are not adjusted for performance at the time of grant; the correlation between pay and performance is likely much higher once payouts are realized
1 The S&P/TSX 60 is a subset of the S&P/TSX Composite. It has 60 constituents and represents Canadian large cap securities with a view to matching the sector balance of the S&P/TSX Composite Index
2 For the purposes of this document, TDC is equal to the sum of base salary, actual short-term incentives paid, and expected value (or grant date fair-value) of long-term incentives granted
3 Source: Equilar (leading provider of Executive Compensation data)