Executive Summary
 In 2024, shareholders broadly supported compensation decisions among TSX60 issuers, reflecting acceptance on pay and performance alignment, along with measured and prudent use of Board discretion. Continued macroeconomic uncertainty and market volatility may prompt increased shareholder scrutiny of pay-for-performance alignment in 2025.
Incentive frameworks across major Canadian issuers remained relatively stable, suggesting overall confidence and comfort with current structures. Rather than pursuing major overhauls, TSX60 companies made targeted refinements.
Environmental, Social, and Governance (“ESG”) remained a focal point in 2024, with particular attention on Diversity, Equity, and Inclusion (“DEI”). Despite rising political and stakeholder scrutiny, especially in the U.S., Canadian companies remain committed to ESG with increased use of such metrics in incentive programs year-over-year. However, the nature of these metrics is evolving with some companies removing formal DEI metrics or repositioning disclosure language from “diversity” to broader “inclusion” or “talent development” objectives. These changes were common among issuers with significant U.S. exposure, suggesting disclosure sensitivity, rather than shifts in underlying organizational workforce strategy, is driving the decision.
Already in 2025, Canadian companies face growing macroeconomic uncertainty and market volatility, creating challenges in forecasting and assessing performance. Nonetheless, this period of global change presents an opportunity for Boards to think strategically, identify new growth avenues, and leverage incentive structures to support long-term value creation.
Key Definitions
- Short-term Incentives, “STIs”; Short-term Incentive Plan, “STIP”: annual cash bonus whereby payouts are typically based upon achievement of short-term (1-year) objectives (financial, strategic, individual).
- Long-term Incentives, “LTIs”; Long-term Incentive Plan, “LTIP”: LTIs link compensation to a period that typically exceeds twelve months (typically three to five years) to retain, incentivize and motivate employees. LTIs are most commonly equity-based, but cash-based plans are also used. LTIs may include (but not limited to) restricted units, performance units, deferred units, and stock options.
- Total Cash Compensation, “TCC”: the sum of an employee’s base salary + short-term incentives (“STIP”, i.e., annual bonus).
- Total Direct Compensation, “TDC”: the sum of TCC + long-term incentives, excluding “other compensation” (e.g., benefits, perquisites) and pension.
2024 Performance Update
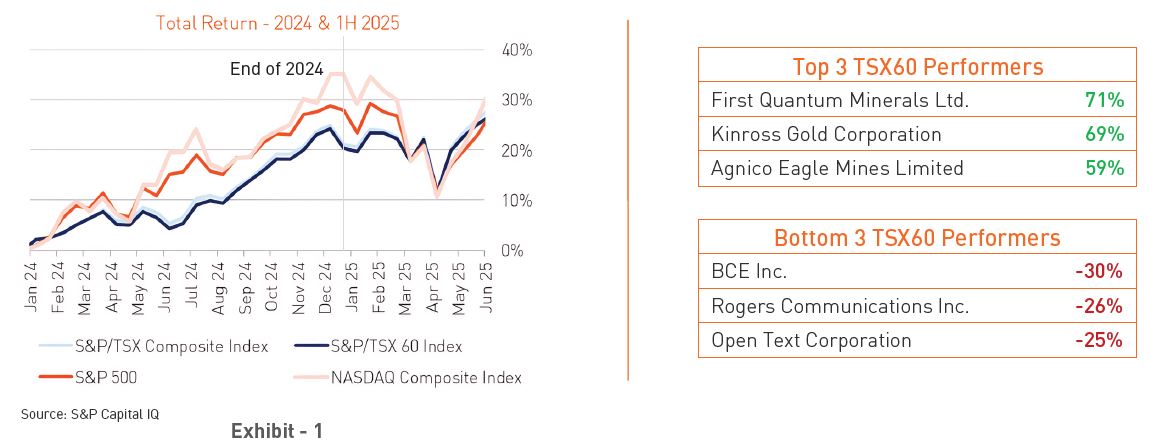
2024 delivered robust equity-market returns on an absolute basis with the S&P/TSX60 and S&P/TSX Composite Index both up roughly 17% (Exhibit 1). These double-digit gains mark a significant rebound from the negative returns of 2022 and the modest gains of 2023, though they trailed the U.S. market, where the S&P 500 rose about 23%. In Canada, performance varied by sector: energy and materials - comprising 30% of the TSX60 - benefited from strong commodity prices, while telecommunications lagged due to increased regulation, intense competition, and slowing subscriber growth. Across both Canada and the U.S., easing interest rates provided a further boost, supporting broad market momentum through year-end.
Halfway through 2025, markets are reacting to shifts in U.S. trade policy and rising global trade barriers. Although some early-year losses were mitigated by policy pauses and reversals, trade dynamics remain fluid, contributing to an uncertain outlook.
2024 Pay Levels Update
-
Target Compensation is the expected pay opportunity for expected performance (i.e., before assessing actual performance)
-
Actual compensation is the total pay that an individual is awarded after performance is assessed relative to target
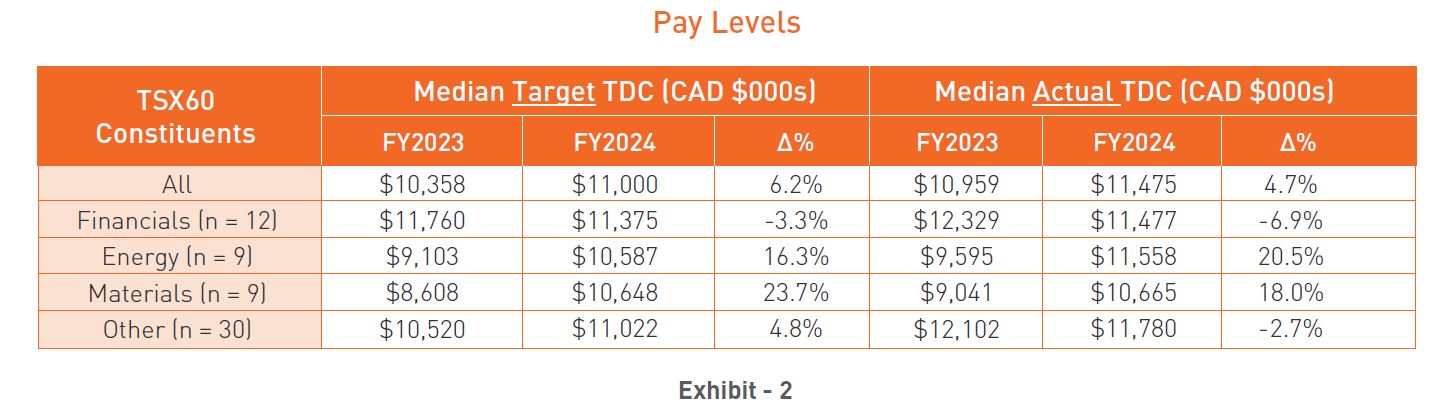
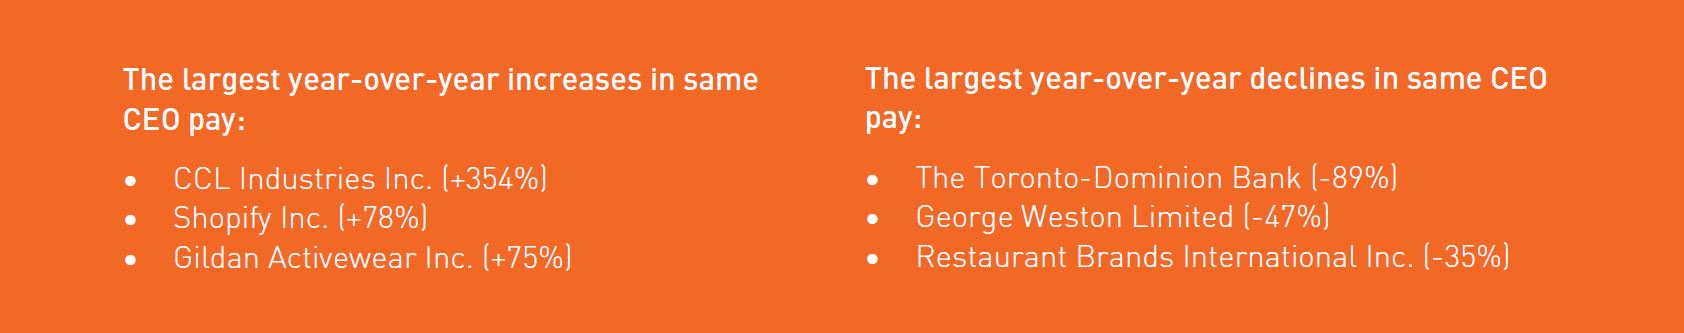
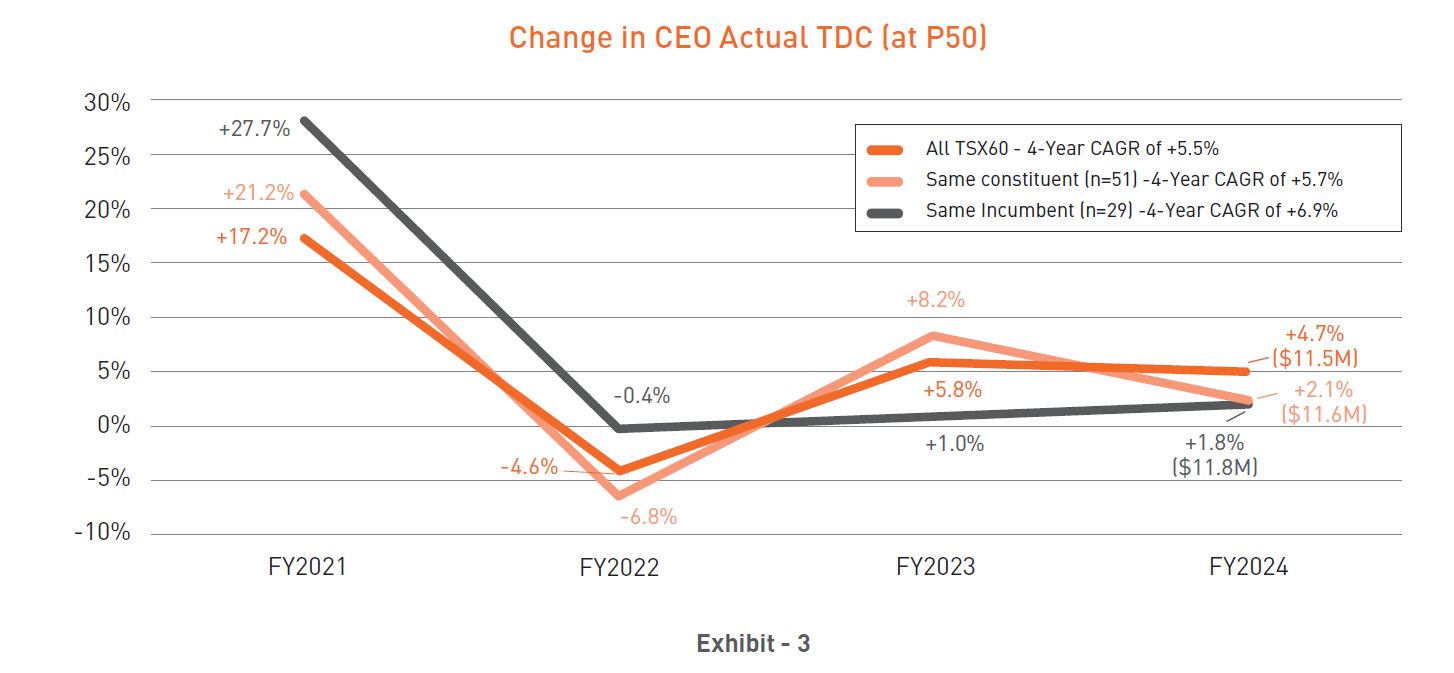
Median target TDC among TSX60 CEOs issuers increased 6.2% in 2024 (Exhibit 2), compared to 2.0% in 2023. On an actual basis, median CEO TDC increased 4.7% year-over-year, driven by above target STIP payouts and large target increases in the materials and energy sectors. Among materials companies, the large increase continued a trend of significant gains last year (+27% at median in 2023), reflecting ongoing strength in commodity pricing and financial results. In the energy sector, 2024 pay increases represent a rebound from a roughly 4% decline in 2023, driven by a “bounce-back” in Canadian oil pricing. Among financials, the year-over-year decline in actual pay was influenced by pay decisions at TD Bank, where the CEO received no bonus or LTI award following anti-money laundering issues in the US.
Among companies that have been in the TSX60 for the past 5 years (“Same Constituent”) and CEOs who have held their roles over the same period (“Same Incumbent”), median actual TDC increased slightly YoY, trailing the broader index (at median). This suggests that a mix of new executives and/or constituents drove higher percent increases (Exhibit 3). Over the full five-year period, however, both groups observed compounded annual growth rates (“CAGR”) exceeding the index, indicating new entrants and/or CEOs weighed on overall index pay.
Pay Design Update
Short Term Incentive Plan
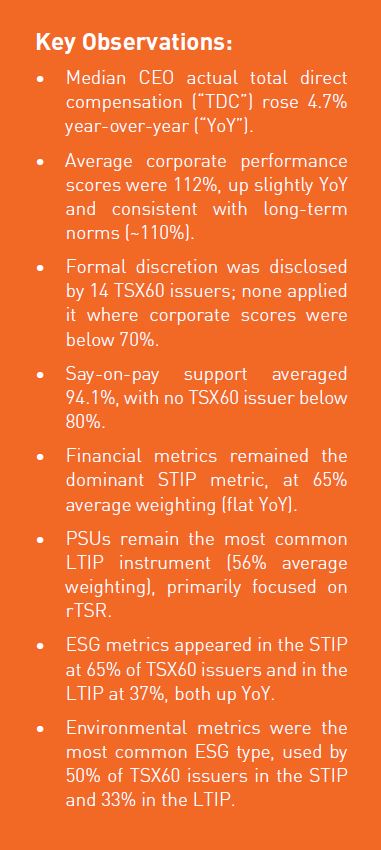
STIP designs have been generally stable year-over-year, including consistency in the average weighting of corporate performance measures (see Exhibit 4). Other key observations include:
- The number of metrics included in corporate scorecards has gradually increased to an average of approximately 6.
- Financial metrics remain the most prevalent and highest-weighted performance metrics in 2024 (i.e., 53 companies disclose the use of a financial metric). For those without financial metrics, STIP programs are generally discretionary or lack disclosure on plan details.
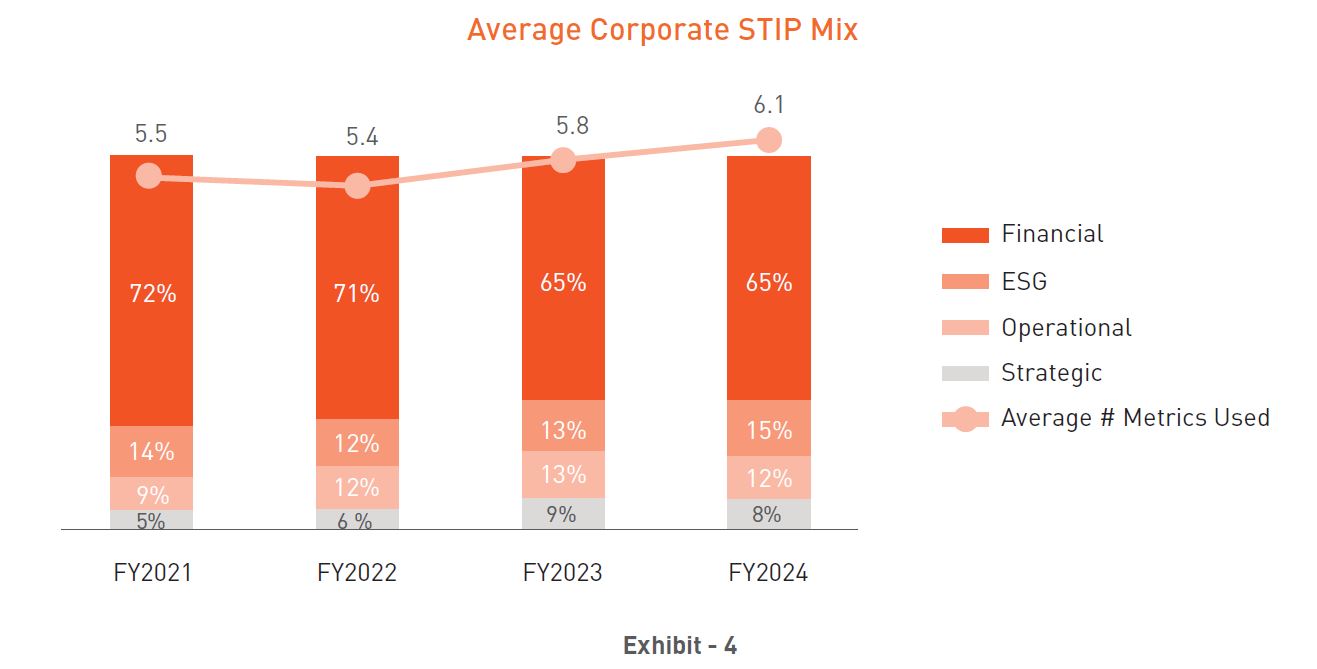
Over the long-term, the average weighting of financial metrics has gradually declined with weightings shifting to strategic, operational, and ESG objectives suggesting a desire to provide a more holistic view of corporate performance. Complementing quantitative measures with qualitative metrics can also reduce the volatility of incentives and provide Boards with the ability to more easily use judgement to evaluate incentive programs. This may be particularly relevant for organizations in volatile industries where it is challenging to set robust long-term performance targets.
Among TSX60 issuers, usage of ESG metrics in the STIP remains strong, with 65% of companies incorporating such measures in 2024 – up from 62% in 2023. Among these companies, the average ESG weighting remained steady at 18% year-over-year. A majority (25 of 39) use a “basket” approach[1], providing flexibility to adjust ESG priorities and metrics annually. Across all TSX60 issuers, environmental measures remain the most common ESG metric (50% prevalence among TSX60 issuers, Exhibit 5), followed by Health and Safety (35%), and Governance (30%). To date, Hugessen is not aware of any TSX60 companies that have removed climate metrics in their incentives as a direct result of the “anti-greenwashing” provisions in Canada’s Bill C-59[2],[3].
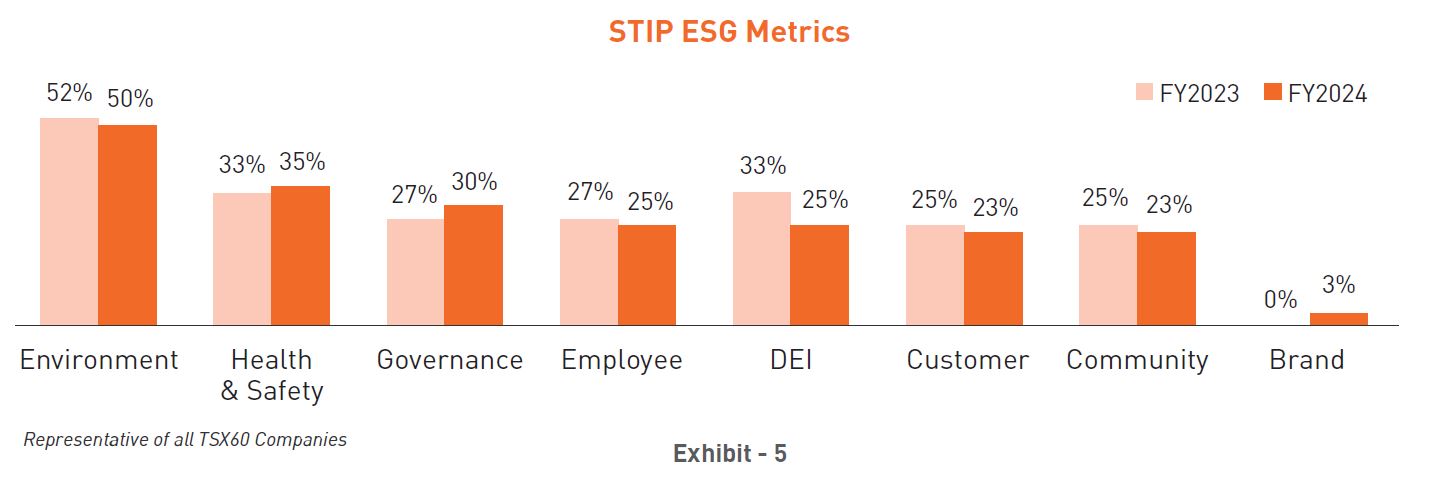
In 2024, there was heightened scrutiny on Diversity, Equity, and Inclusion (“DEI”) metrics, with 7 companies removing these metrics and 2 companies adding them into their corporate scorecards. Notably, the majority of companies that removed DEI metrics from the STIP have significant U.S. exposure – ranging from approximately 25% to upwards of 75% of total revenue. These adjustments may reflect recent U.S. political developments, such as shifts in government procurement policies and Supreme Court rulings on affirmative action and diversity-targets at U.S. universities. Some organizations that retained DEI metrics reclassified them under broader talent management or inclusion objectives, implying that political and stakeholder disclosure concerns - rather than shifts in workforce strategy - are influencing DEI decisions.
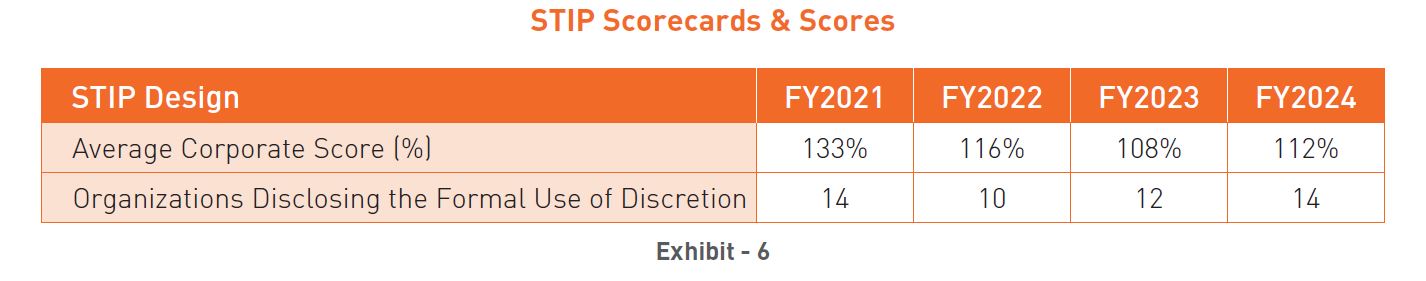
In 2024, short-term incentive programs generally paid out above target with the average corporate score rising to 112%. This is near the long-term average of ~110%[1], but remains below the high of 133% seen in 2021.
The application of discretion rose slightly year-over-year, with 14 Boards disclosing formal adjustments to results upwards (n=9) or downwards (n=5). Of those who applied positive discretion, most (n = 5/9) applied discretion to specific metrics (rather than overall scores) for a variety of reasons, including M&A, macroeconomic factors outside of Management’s control, or performance not captured in calculated business results. Among the companies who applied negative discretion, a majority (n = 3/5) applied discretion to the overall score reflecting safety failures, weak relative performance, or notable negative business events. Notably, no discretion was applied among the 8 companies with corporate scores below 70%, suggesting Board discipline and confidence around pay-for-performance alignment.
Long-Term Incentive Plan
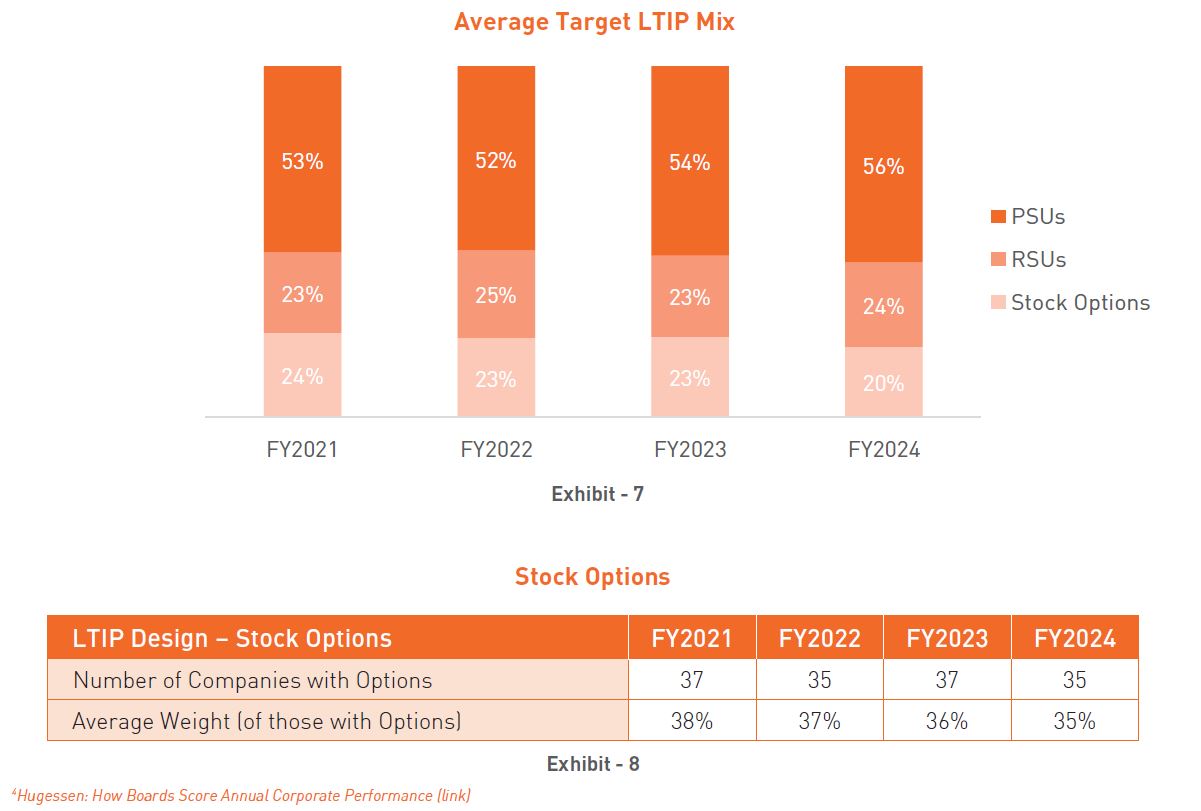
The average mix of long-term incentive instruments among TSX60 companies remained stable year-over-year (Exhibit 7), with a continued slight shift to PSUs. Stock options continue to be commonly used, however, among those who use stock options, the average weighting of options has continued its gradual decline over the long-term (Exhibit 8). In Canada, stock options continue to be attractive from a cost benefit analysis for many issuers – namely the potential gains from an accounting and/or disclosed grant date compensation value. Looking ahead, we expect the continuation of long-term LTIP trends with LTI mix decisions driven by company-specific factors such as pay philosophy, leverage, and retention considerations.
Relative Total Shareholder Return (“rTSR”) remains the most prevalent PSU metric (Exhibit 9). In 2024, in response to market volatility and evolving geopolitical dynamics, we observed several companies (n=6) revisiting the measurement approach to rTSR, including adjusting performance peer groups and/or calibration. We expect this trend to continue.
Beyond rTSR, return metrics (i.e., ROIC, ROE, ROCE, etc.) continue to increase in prevalence (Exhibit 10) recognizing the utility of these measures in aligning executive pay with internal company performance, and when used with rTSR, the shareholder experience.
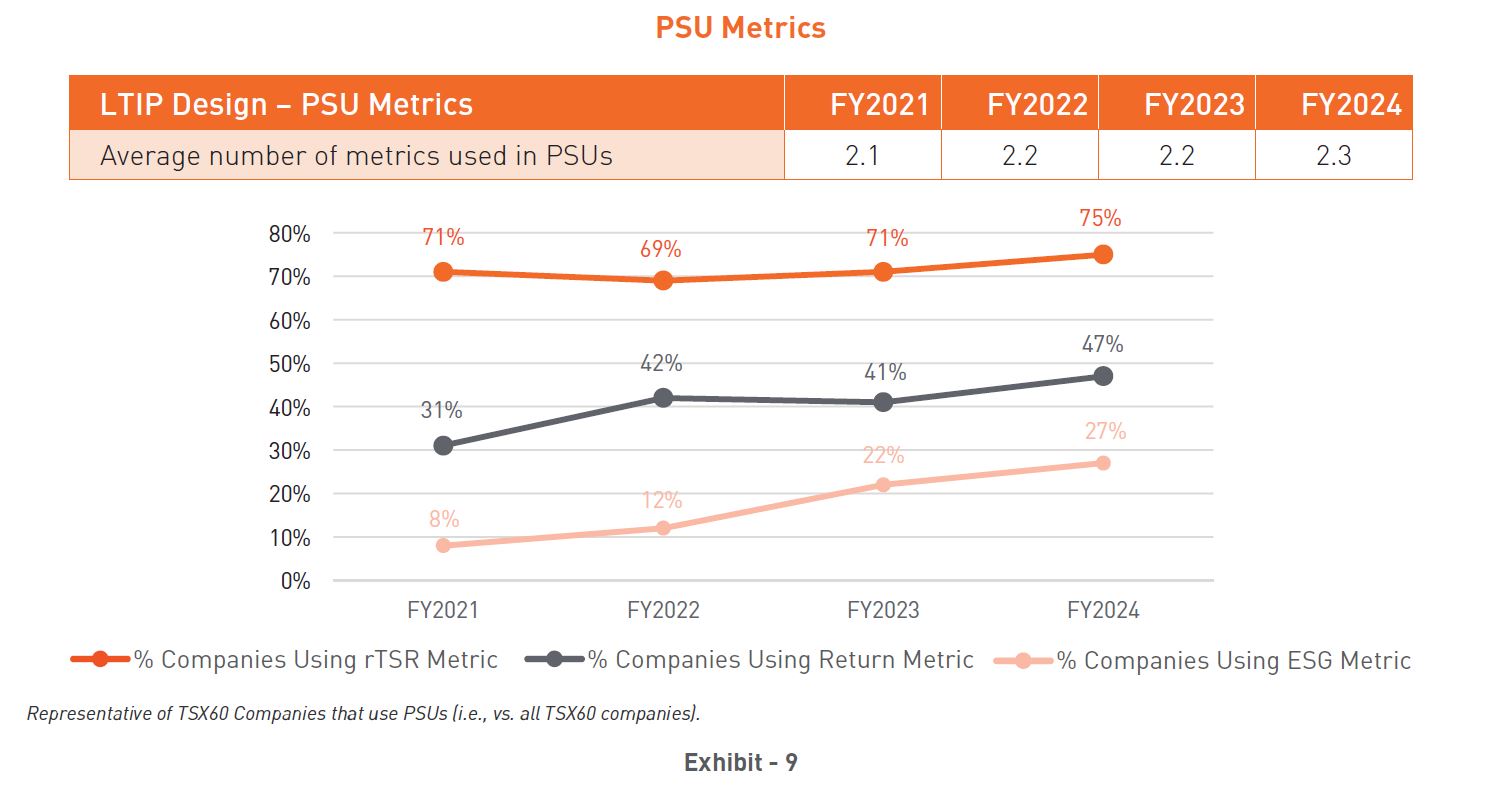
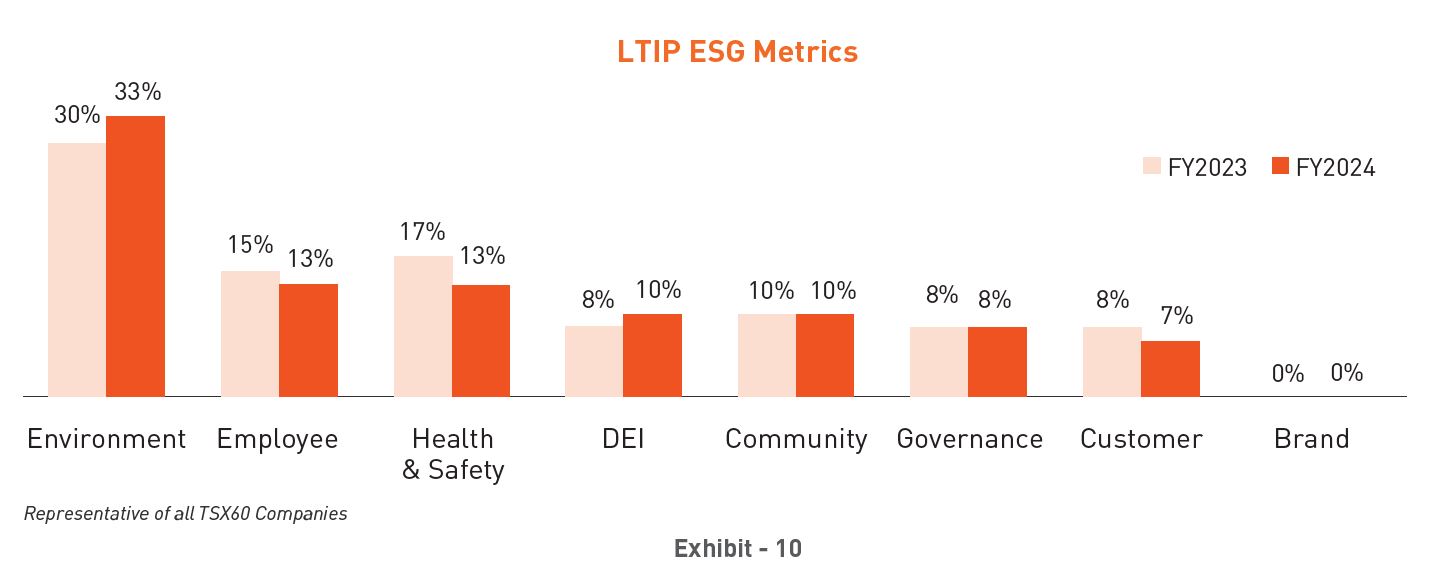
In 2024, the adoption of ESG metrics in long-term incentive plans continued despite recent headwinds - such as political “anti-ESG” rhetoric and regulatory developments (e.g., Bill C-59) – highlighting that many companies continue to view ESG as a meaningful indicator and driver of long-term business success. Of note, 3 new companies incorporated ESG measures within PSUs, suggesting growing commitment to long-term ESG performance and increased confidence in setting robust long-term targets. As with STIPs, environmental metrics remain the most common ESG measure in LTIPs and continue to increase in prevalence over time (see Exhibit 10).
Say-on-Pay Update
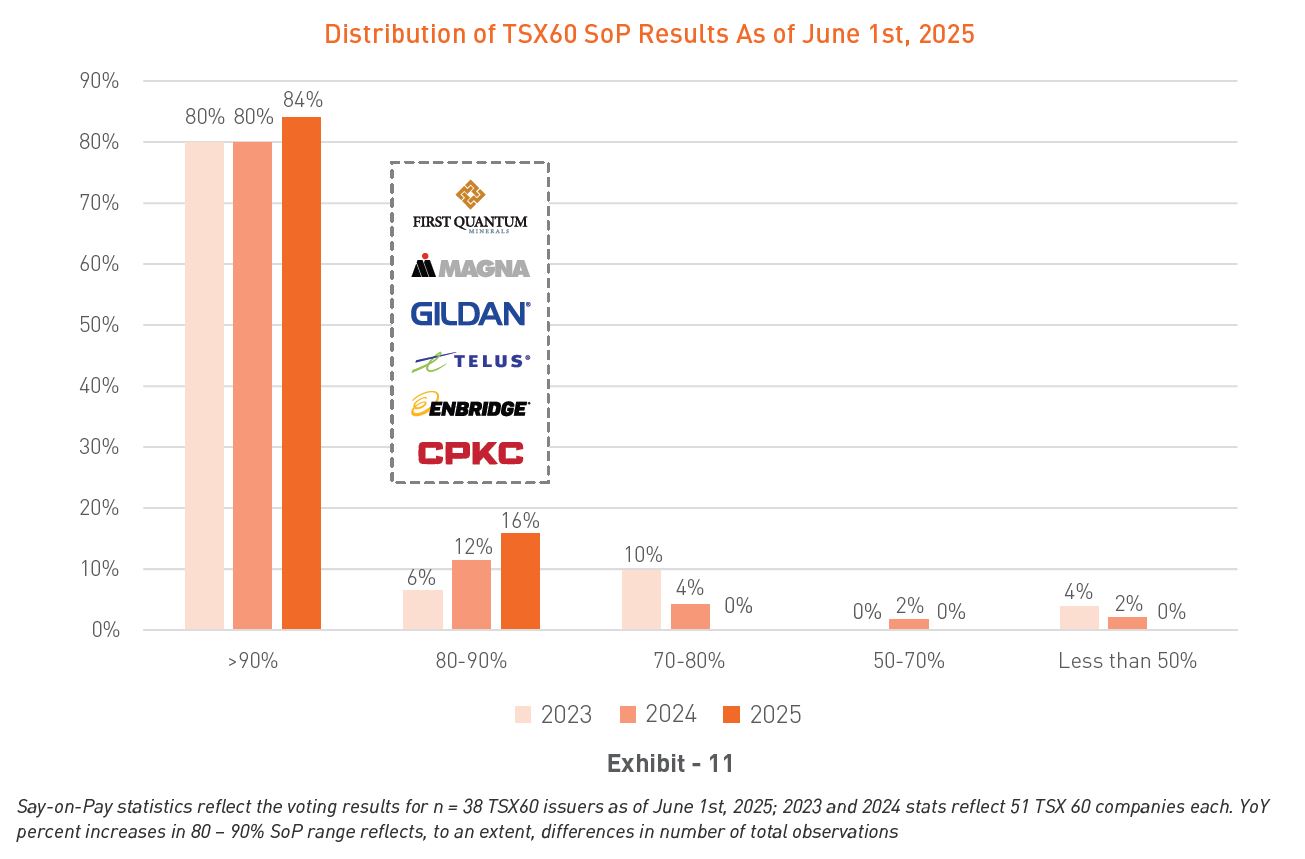
Among the Say-on-Pay (“SoP”) results available to date[5], we are observing an increase in support levels relative to 2024 across the TSX60 (Exhibit 11):
- The average voting results at the highest level (~94.1%) over the past 4 years
- No TSX60 company has reported SoP results below 80% (4 in 2024)
- No TSX60 company has failed SoP (1 in 2024) while only one TSX Composite company has failed (down from 3 in 2024)
Across Canada, strong SoP support suggests general shareholder acceptance with compensation decisions and pay-for-performance alignment. While the specific rationale behind investor voting is not always clear, the combination of strong share price performance, corporate scores aligned with long-term averages, and limited use of discretion for significantly low scores (i.e., below 70%) appears to have reassured shareholders of prudent Board decision-making and alignment between pay and performance.
Already in 2025, economic uncertainty has created headwinds. In weaker performance environments, companies often face heightened scrutiny from shareholders and proxy advisors, increasing pressure on Boards to ensure incentive outcomes reflect overall performance. While it’s too early to predict how 2025 will unfold, we expect pay-performance alignment to remain a key focus in Boardrooms through the rest of 2025.
Board Effectiveness
Board Renewal
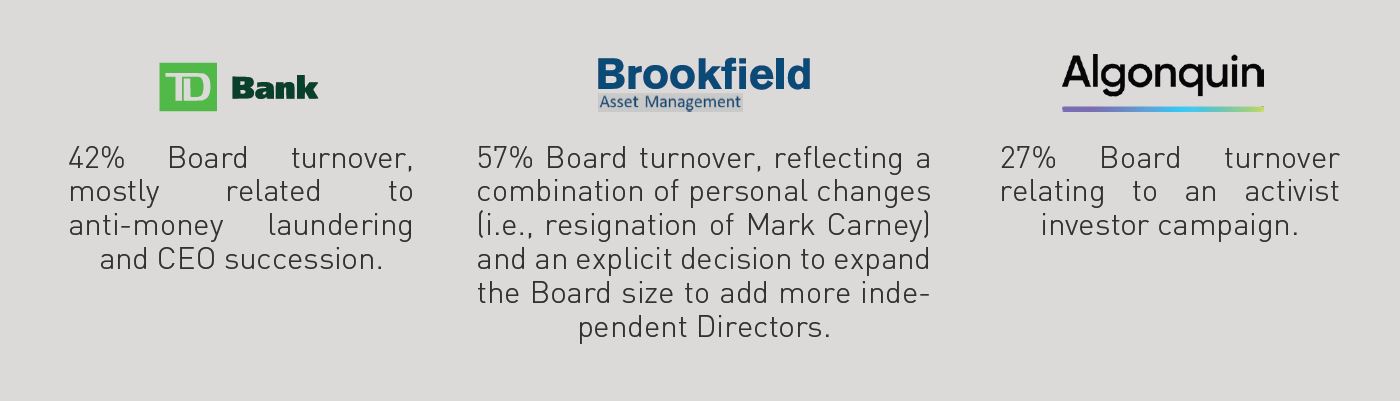
In 2025, Boards renewed at a normal rate in line with long-term averages. However, notably 8 Boards saw “significant” turnover with more than 3 Directors, up from 5 Boards last year. Three of these Boards saw significant turnover relating to specific factors, namely:
The use of mandatory retirement policies remains steady amongst among TSX60 issuers, with 40% using age limits and 45% using term limits. A significant portion of Boards (37%) have neither policy in place. While term and age limits are generally rationalized as a means of supporting Board renewal, Boards are increasingly reviewing such policies from a strategic perspective, assessing the why behind such policies (i.e., as a tool or “checklist” item). Boards are increasingly leaning on strategic value-add and Director performance to drive renewal; ensuring that the Board is composed of the skills and capabilities that meet evolving business needs.
Board Assessments
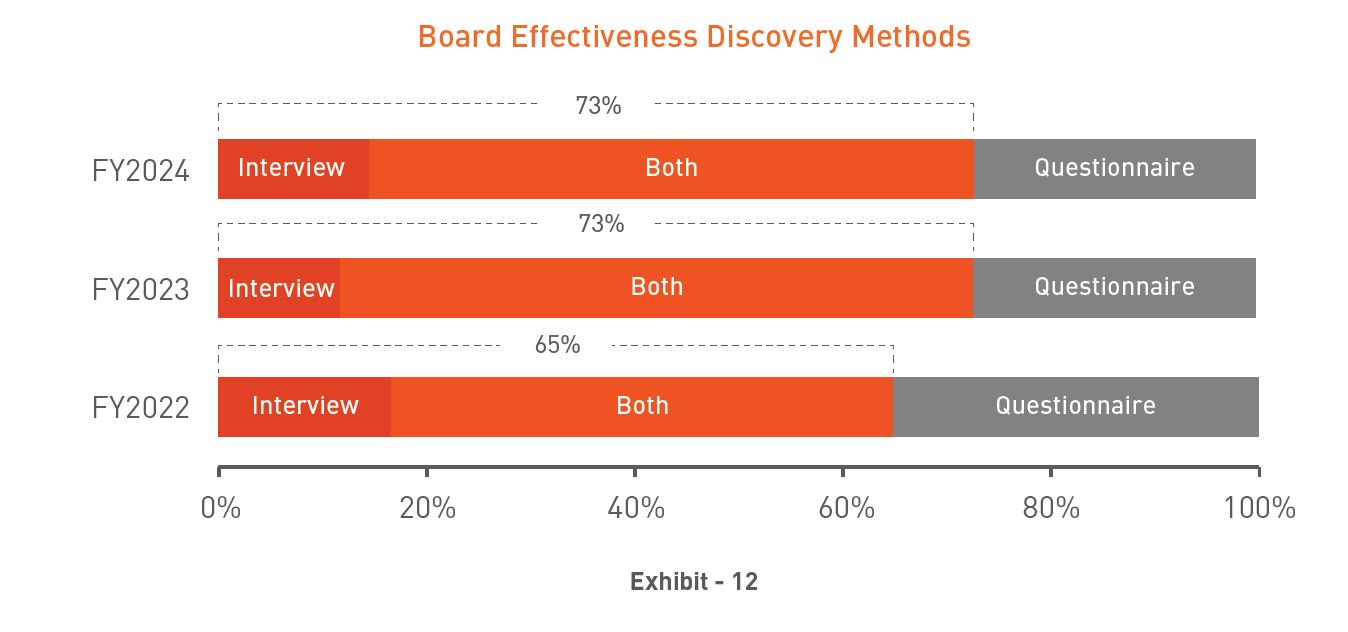
The majority of TSX60 Boards conduct annual assessments of Board effectiveness and performance increasingly using interviews (either on their own or in combination) as the primary discovery method (Exhibit 12). This reflects the increasing desire for depth, nuance, reflection, and context reviewing the Board’s effectiveness, which is generally not well captured in questionnaires.
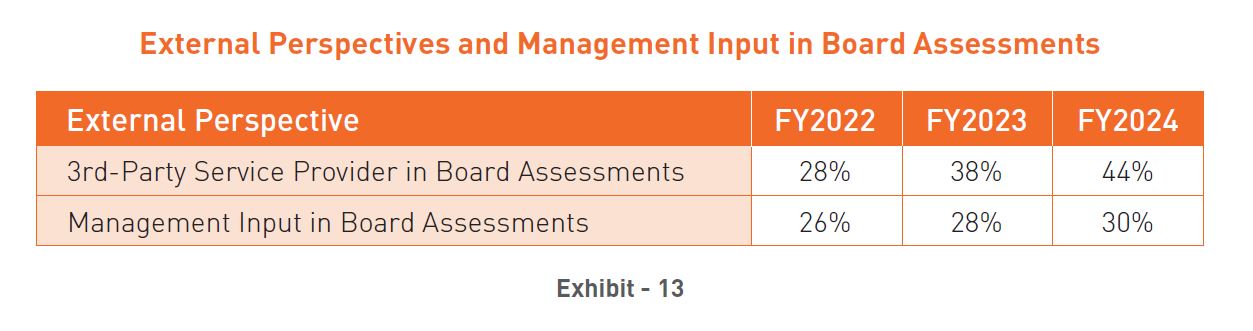
Boards are also increasingly using external perspectives to enrich the assessment process. In 2024 nearly half of the TSX60 disclosed engaging a 3rd party provider to facilitate a Board effectiveness review (either annually or once every 2-3 years) and roughly a third have incorporated upward Management input (Exhibit 13). Together, these reflect a mindset shift in Boardrooms with an increasing focus on open feedback to help Boards identify blind spots, strengthen trust with executive teams, leverage better practices from other Boards, and ensure that practical actions are taken.
Board Diversity
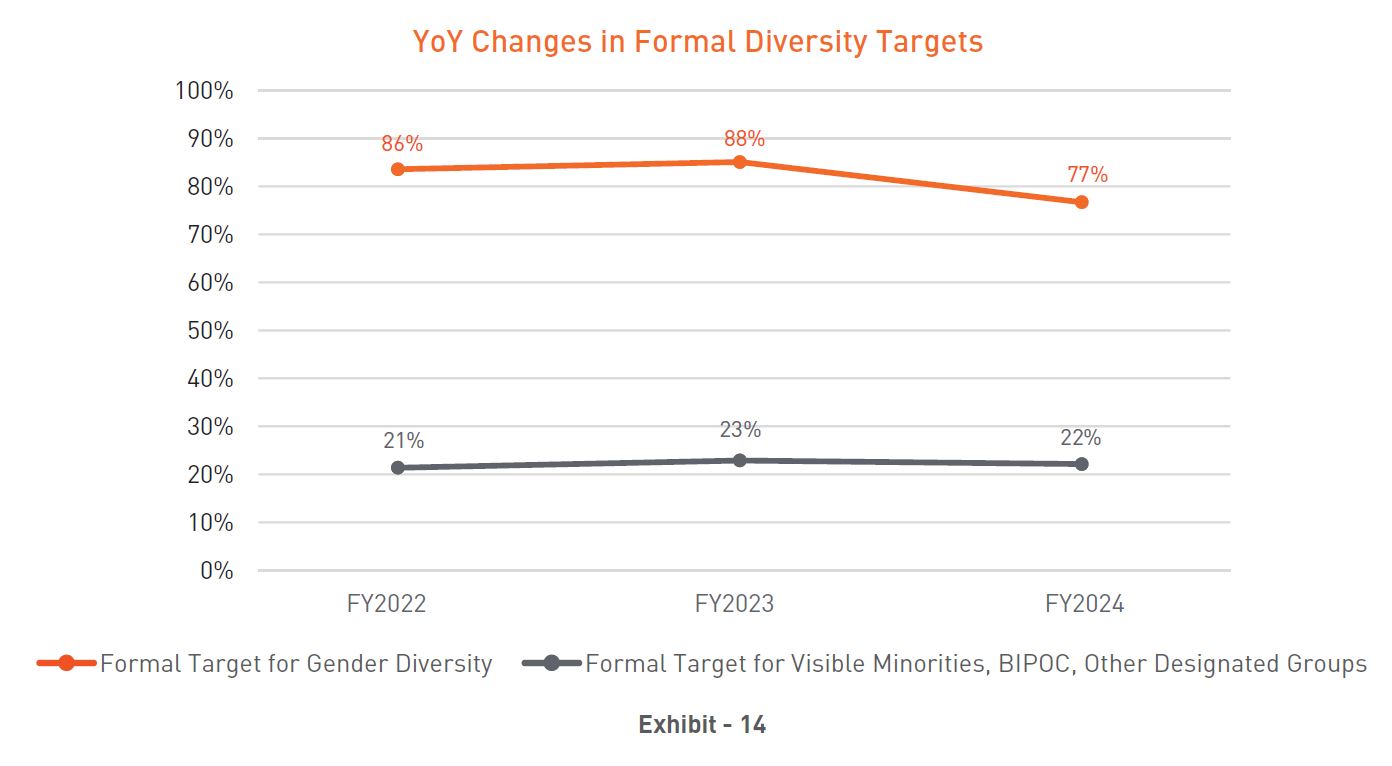
Board diversity remains a key focus among TSX60 issuers, with 95% maintaining formal diversity policies - a figure that has remained stable in recent years. Notably, 77% of issuers have established formal gender diversity targets (e.g. 30% of the Board to be women) while 22% have set targets for Visible Minorities, BIPOC, and other designated groups.
The prevalence of formal gender diversity targets declined from 88% in 2024 to 77% (Exhibit 14), which may reflect growing concern among some Boards about the legal and political risks associated with formal numerical targets. This concern may be particularly heightened for Boards with significant U.S. exposure considering recent U.S. political developments. Despite this, Canadian Boards appear committed to advancing diversity, both through the continued use of diversity policies and through increasing gender representation in the Boardroom, which reached 38.5% gender diversity (at median) in FY2024.
Other Governance Trends
Share Ownership Guidelines (‘SOG”)
In 2023, certain shareholders began taking a firmer stance on executive share ownership, with groups such as the Canadian Coalition for Good Governance (“CCGG”) advocating that only common shares and Deferred Share Units (“DSUs”) should count toward share ownership requirements.
As in 2023, a minority of TSX60 companies (29%) fully align with CCGG’s guidance on share ownership guidelines. Most issuers continue to include RSUs (62%) followed by PSUs (38%) in their ownership calculations. To date, this approach has not generated significant shareholder pushback, suggesting general investor comfort with prevailing practices. That said, in 2024 National Bank was a notable mover, updating its SOG to require minimum holdings in both common shares and unvested RSUs/PSUs, aligning with CCGG guidance. Moreover, National shifted the basis of SOG multiples from base salary (8x for the CEO) to target TDC (3x for the CEO), resulting in a material increase in the absolute quantum of ownership requirements.
It remains to be seen whether shareholders will press more strongly for increased “real” equity ownership, and Boards should seek to understand their shareholders’ perspectives on this topic.
Conclusion
Looking ahead to 2025, Canadian companies face growing uncertainty and volatility. While the full impact of evolving geopolitical and trade dynamics remains unclear, Boards must prepare for a more challenging operating environment and increasingly dynamic external landscape. It remains to be seen how organization incentives might respond to such an environment, although we expect conversations on pay-for-performance alignment and volatility in incentives are likely to be front and center in Boardrooms.
Despite the challenging environment, 2025 presents a unique opportunity. Shifting economic dynamics and a renewed focus on "nation-building" in Canada offer Boards a unique opportunity to think boldly and adapt strategies to unlock new avenues of growth, including leveraging incentives to motivate and reward for success. As the landscape continues to evolve, Boards and Human Resources Committees are well-positioned to elevate their impact and help organizations seize the moment to drive long-term value creation
[1] For details on the different types of approaches to ESG metrics, see Hugessen’s ESG in Compensation: Learnings from the 2023 Proxy Season (link)
[2] Hugessen: Bill C-59 Compensation Implications (link)
[3] RBC publicly removed business sustainability targets due to Bill C-59 in April 2025. At this time, it remains to be seen what impact (if any) this may have in their incentive programs.