Hugessen has completed its annual review of the 2023 TSX60 proxy circulars, and we are pleased to share key findings on executive pay levels, incentive design, Say-on-Pay results, and other governance topics.
In addition to delivering our TSX60 proxy takeaways, we have provided additional commentary on emerging topics such as the use of one-time CEO awards and the impacts of the current macroeconomic uncertainty on setting executive pay targets.
Please click above for the webinar recording, download the TSX60 slides here and the briefing document here.
In Summary
Several macroeconomic and geopolitical factors rattled shareholder confidence and the strength of global financial markets in 2022. The ongoing war in Ukraine with the resulting impacts on global commodity prices and supply chains, persistent inflationary environment which led central banks to undertake aggressive monetary policy, the deterioration of Sino-U.S. relations, the extreme incidence of global drought, and the massive wave of layoffs experienced by technology professionals are a few notable examples.
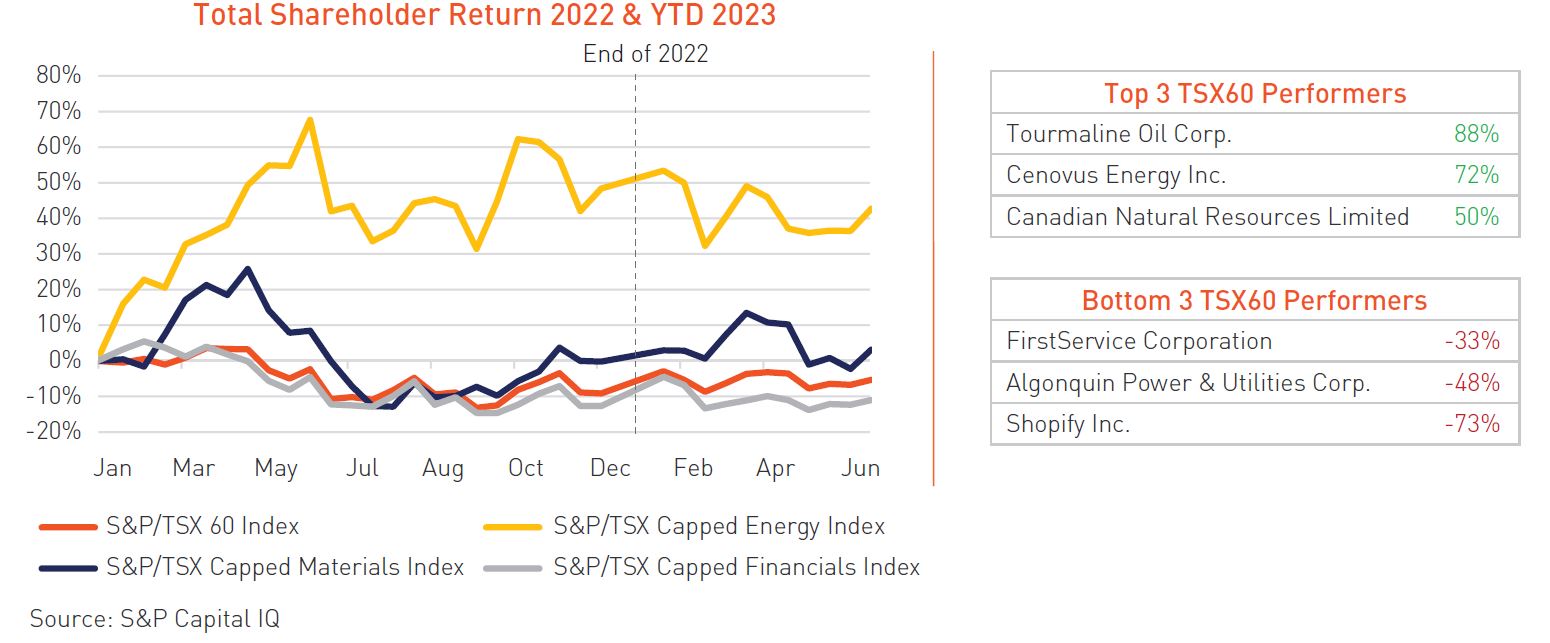
Considering this context, the S&P/TSX 60 Index closed the year with a negative return of approximately 9%, marking a sharp reversal from the 24% gain recorded in 2021. On the other hand, the energy sector continued to outperform the broader market, with the S&P/TSX Capped Energy Index posting a return of 42%.
As we enter the second half of 2023, global markets appear to have stabilized; however, inflation remains top of mind as global investors anxiously monitor central bank policy to assess the likelihood of a recessionary period.
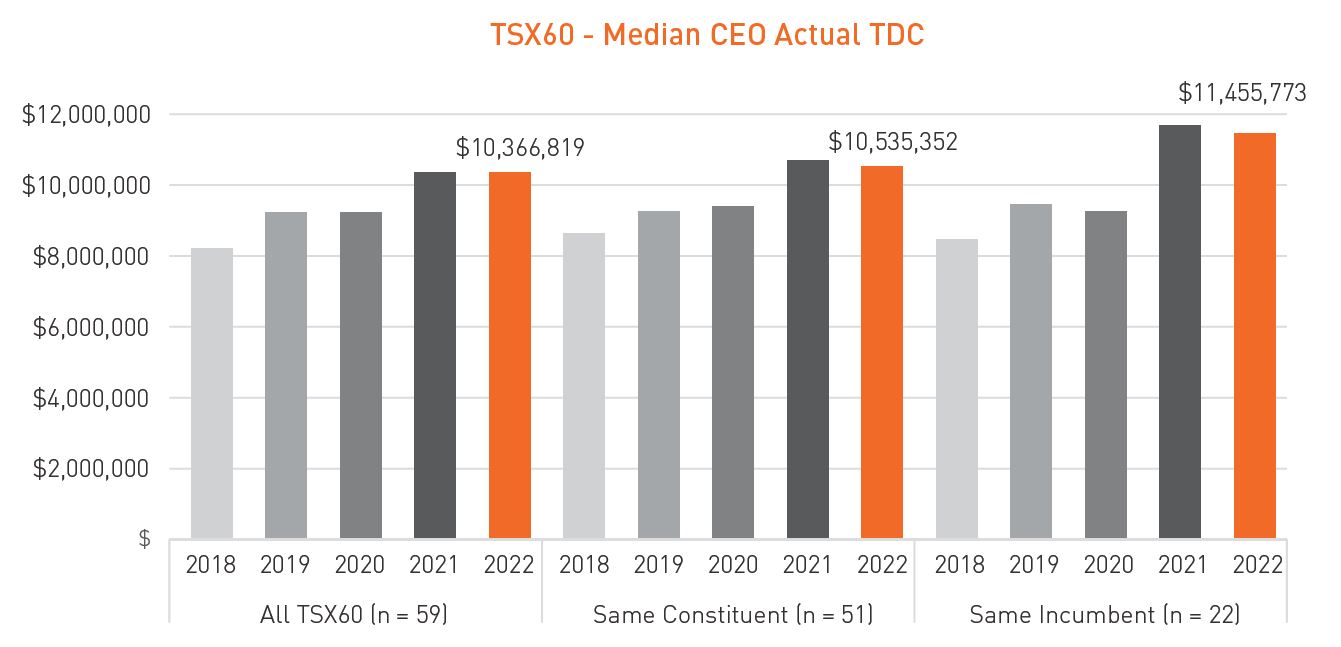
Among the TSX60 in 2022, median actual CEO total direct compensation (sum of base salary, annual bonus and grant date fair value of long-term incentives) remained virtually flat year-over-year (+0.1%), whereas same incumbent CEOs experienced a close to 2% decline relative to 2021. This in stark contrast to the 12% increase in median actual CEO TDC recorded in 2021, driven by strong corporate performance scores (i.e., ~133% in 2021 vs. ~116% in 2022, on average).
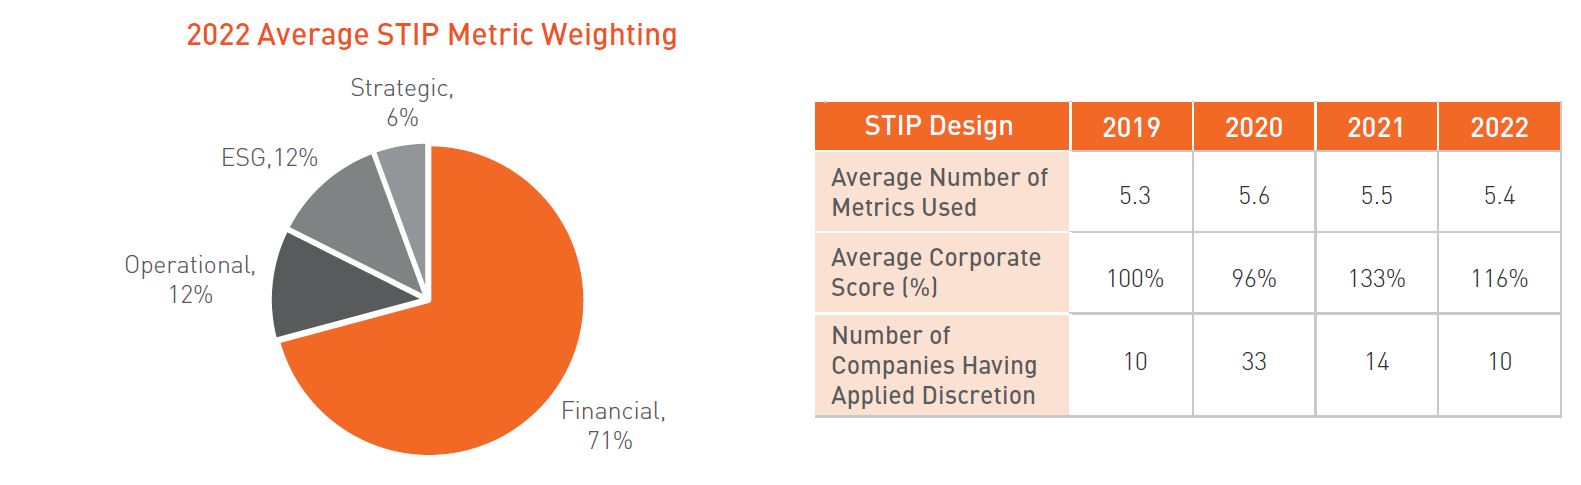
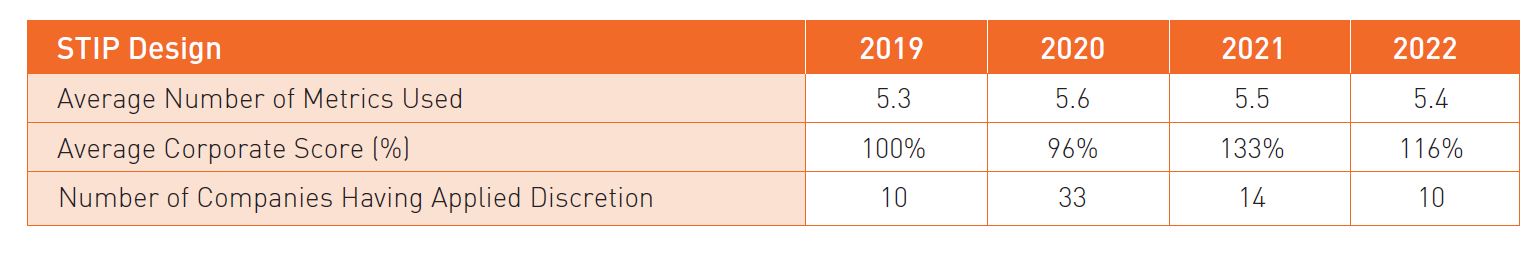
Short-term incentive plan (“STIP”) design remained relatively stable year-over year. Beyond the continued adoption of Environmental, Social, and Governance (“ESG”) metrics, financial metrics remain the most widely held performance measure with an average STIP scorecard weighting of ~71%. However, outside the composition of the performance metrics, we note a continued decline in the use of formalized discretion among TSX60 issuers in 2022 (i.e., adjustments to CEO STIP payouts made by the Board/Human Resources Committee that fall beyond the formulaically driven results). 10 companies have used formalized discretion as part of their STIP in 2022, compared to 14 and 33 companies in 2021 and 2020, respectively. This reflects a reversion to pre-pandemic levels, whereby 10 companies used discretion in 2019.
Median Board director annual total retainer remained relatively flat in 2022 (i.e., ~-1%), whereas the median Board Chair annual total retainer increased by approximately 4% year-over-year from $460K in 2021 to $480K in 2022.
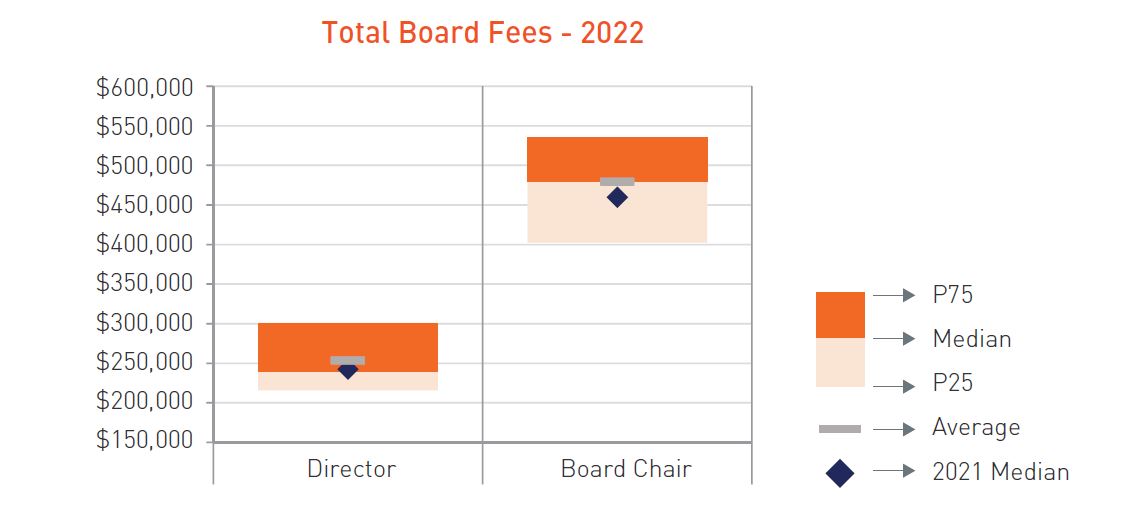
Further, we are observing an acceleration in the adoption of flat-fee structures (i.e., no meeting fees) among TSX60 issuers, with nearly 92% of companies leveraging this structure in 2022, compared to 84% and 80% of companies in 2021 and 2020, respectively.
2022 Pay Levels Update
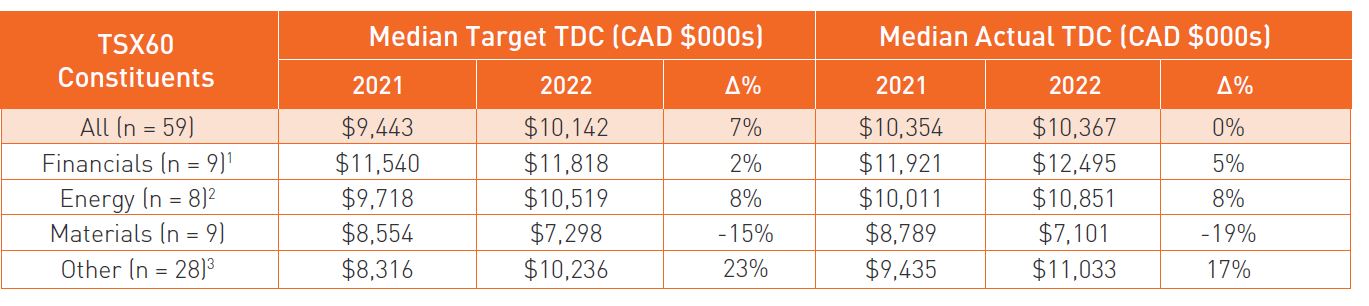
1 - Excludes Brookfield Corporation, Brookfield Asset Management, and Intact Financial (Brookfield Corporation and Intact Financial were not TSX60 constituents in 2021, and Brookfield Asset Management and Brookfield Corporation have the same CEO)
2 - Excludes Tourmaline Oil (not a TSX60 constituent in 2021)
3 - Excludes Hydro One (not a TSX60 constituent in 2021)
Median target CEO compensation among TSX60 issuers increased by approximately 7% in 2022; however, median actual CEO compensation remained relatively flat year-over-year. The discrepancy between target and actual compensation is driven by disclosed increases to CEO target pay at over 20% of issuers, and by relatively lower corporate incentive scores in 2022 (i.e., ~17% fall in the average corporate score compared to 2021), leading to smaller year-over-year incentive payouts.
However, some sectors, such as Energy, have experienced more sizeable increases in actual CEO pay relative to the broader index. For energy companies, this appears to be driven by higher corporate incentive scores (i.e., average score of ~131% among Energy companies), and by the sector’s outperformance in terms of total shareholder return.
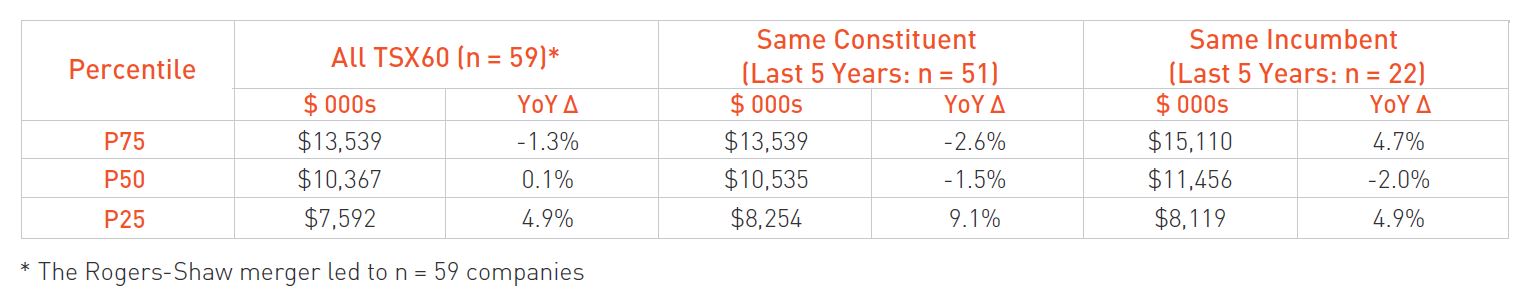
When observing pay levels for companies that have been in the TSX60 for the past 5 years (“Same Constituent”) and for CEOs that have been in their respective roles for 5 years (“Same Incumbent”), both experienced a slight decrease of approximately 2% in actual total direct compensation in 2022. However, when assessing the growth in CEO pay levels over the last 5 years, “Same Constituent” CEOs recorded an actual compensation compounded annual growth rate (“CAGR”) of approximately 5%, whereas “Same Incumbent” CEOs recorded a slightly higher CAGR of approximately 8% (see illustration below).
Pay Design Update
Short-Term Incentive Plan
Financial measures remain the most widely used performance metrics within the STIP (i.e., 54 companies disclose the use of a financial metric), with earnings reflecting the most popular financial measure (i.e., 76% of companies with a financial metric have an earnings measure (EBITDA, EPS, etc.) weighted at ~41%, on average).
Beyond the use of financial measures, ESG metrics, on average, continue to be weighted at over 10% within the STIP, with a slight increase in the number of issuers adopting ESG metrics within their STIP year-over-year. For more information on the use of ESG in executive compensation plans, please refer to Hugessen’s latest webinar on TSX60 Board Governance & ESG. (https://www.hugessen.com/en/news/webinar-trends-and-insights-2023-proxy-season-tsx60-board-governance-esg).
Regarding the size of STIP scorecards, the number of metrics has historically been very steady, ranging between 5 and 6 metrics. However, the average outcome of the scorecards has declined year-over-year, as illustrated by the average corporate score decreasing from ~133% in 2021 to ~116% in 2022. The relative decrease in 2022 corporate scores can be attributed to several factors, notably:
- The strong financial performance and incentive payouts produced in 2021 (i.e., ~33% above target, on average)
- The subsequent decline in average total shareholder return in 2022
- The relative decrease in EBITDA and EPS growth in 2022 compared to 2021, on a median basis
Lastly, 2022 saw a continued decline in the use of discretion by Boards and/or Human Resources Committees with respect to short-term incentive payouts (i.e., adjustments to payouts beyond the formulaic result). As highlighted by the table below, 10 companies in the TSX60 formally applied discretion in 2022, compared to 14 in 2021 and 33 in 2020. This marks a return to the levels observed pre-pandemic, whereby approximately 10 companies or ~16% of TSX60 issuers made use of formal discretion. The spike recorded in 2020 (i.e., more than half of TSX60 issuers applying discretion) coincided with the onset of the COVID pandemic, its financial impacts, and the related uncertainty, which forced companies to make discretionary adjustments to limit the incidence of outsized and/or nullified bonus payouts.

Long-Term Incentive Plan
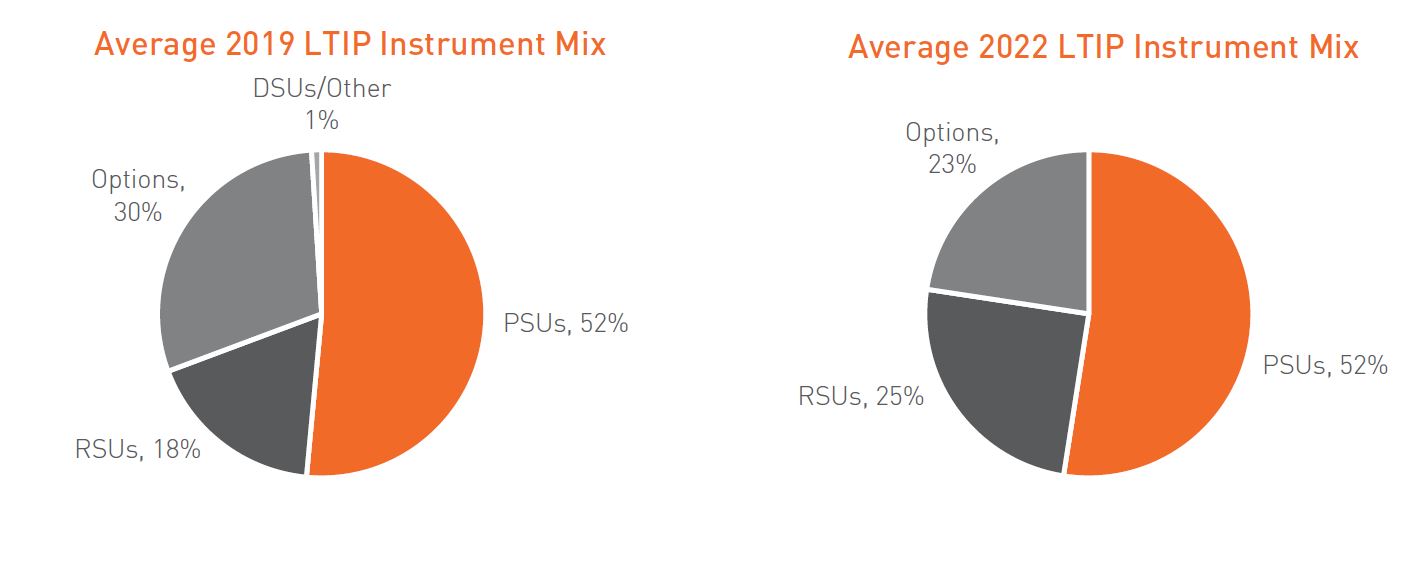
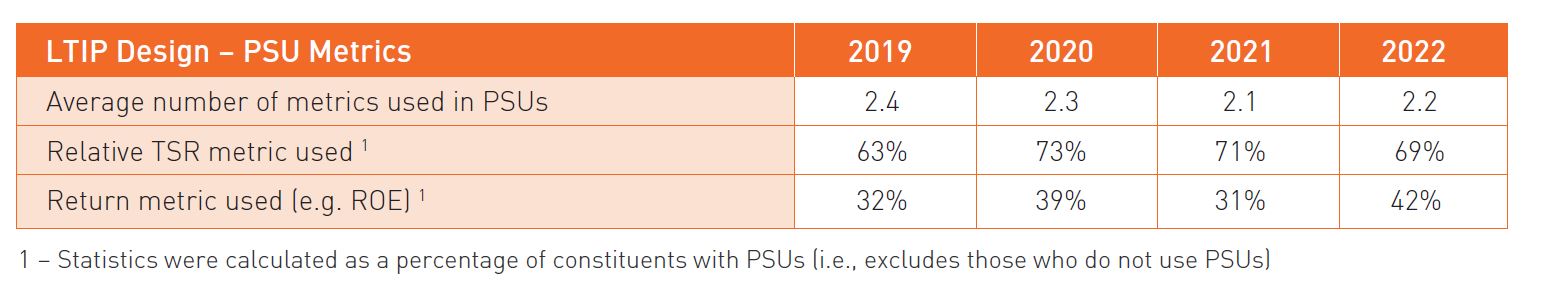
Performance share units (“PSUs”) continue to be the most widely used long-term incentive instrument (i.e., 48 companies use PSUs), reflecting the greatest weighting as part of the LTIP (i.e., > 50%, on average) among TSX60 issuers. Relative total shareholder return (“RTSR”) remains the most prominent PSU metric, used by ~69% of companies that utilize PSUs, followed by return measures (i.e., ROIC, ROE, ROCE, etc.), which are included by ~42% of companies with PSUs.
Regarding the other long-term incentive instruments, we continue to observe a decline in the weighting of stock options as part of the LTIP mix (i.e., ~23% in 2022 compared to ~25%, ~26%, and ~30% in 2021, 2020, and 2019, respectively). Based on Hugessen’s discussions with the director community, this shift appears to be driven by numerous factors, including:
- New Canadian stock option taxation rules implemented in July 2021, which effectively diminished stock options’ preferential tax treatment
- Proxy advisors’ and institutional shareholders’ preference for performance-conditioned share units (i.e., PSUs)
- Increased share price volatility, dampening stock options’ embedded leverage
- Rising macroeconomic uncertainty, making stock options less “attractive” from a retention standpoint in light of their inherently riskier profile relative to PSUs/RSUs, which retain share unit value in times of share price decline
The last factor aligns with the change in statistics since 2019; the weighting of stock options has decreased by ~7% since 2019 among the TSX60, which has been mirrored by a nearly symmetric ~7% increase in the weighting of RSUs over the same period (see illustrations below).
Say-on-Pay Update
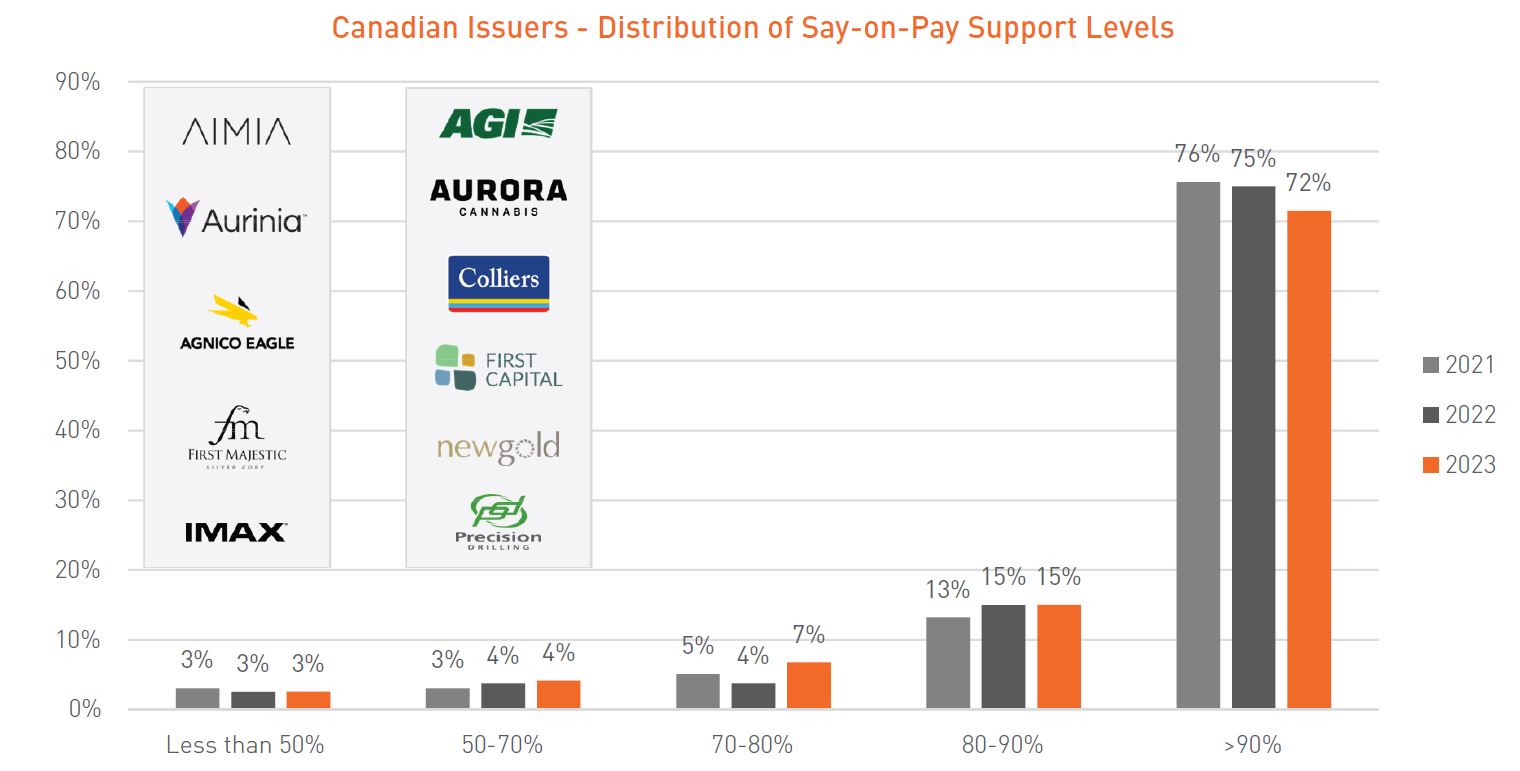
Based on Say-on-Pay results as of June 28, 2023, we are observing a slight decline in support levels relative to prior years, with Canadian issuers recording an average voting result of ~90% (compared to ~91% in 2022 and 2021) and more specifically, with TSX60 issuers receiving an average voting result of ~90% (compared to ~92% and ~93% in 2022 and 2021, respectively).
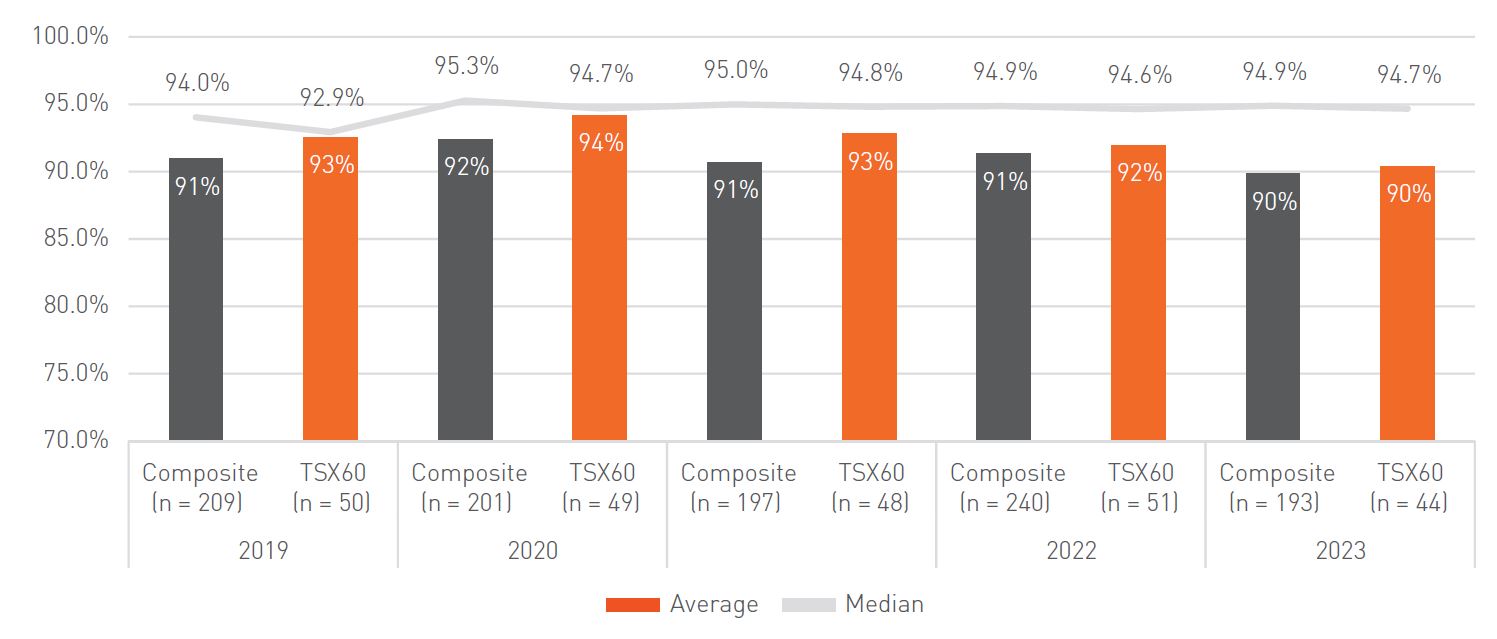
Regarding the distribution of such voting results, the only discernible trend is the year-over-year fall in the proportion of voting results above 90% (i.e., from ~75% in 2022 to ~72% in 2023), and the symmetrical increase in the proportion of voting results between 70% and 80% (i.e., from ~4% in 2022 to ~7% in 2023).
This dynamic is supported by several issuers experiencing a significant fall in Say-on-Pay support year-over-year, from above 90% in 2022 to between 70% and 80% in 2023, notably:
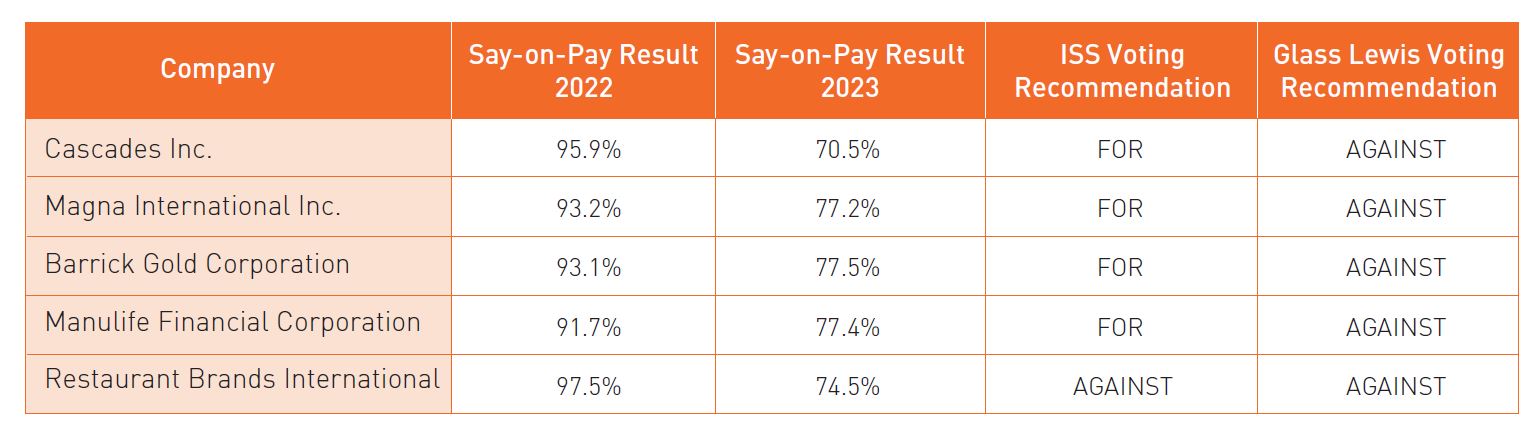
As illustrated by the table above, a common theme among such companies is the fact that they have all received an “AGAINST” recommendation from proxy advisor Glass Lewis. More specifically, the mentioned companies were all “flagged” by Glass Lewis for one or more of the following practices:
- Pay for Performance Disconnect
- Lack of alignment between CEO compensation and total shareholder return, which, in several instances, was exacerbated by the use of sizeable one-time awards or “excessive” sign-on awards
- Concerning Pay Practices
- The lack of sufficient pay disclosure and/or an LTIP performance period shorter than 3 years
Interestingly, these problematic pay practices largely reflect the issues observed among Canadian issuers having either failed their Say-on-Pay vote (i.e., < 50%), or having recorded low levels of Say-on-Pay support (i.e., < 80%) in 2023. However, beyond a lack of alignment between pay and performance, or the grant of substantive one-time payments, several issuers this year have been flagged by proxy advisors for failing to respond to shareholder concerns raised as part of last year’s Say-on-Pay vote, which highlights the importance of engaging with shareholders and stakeholders.