Hugessen has completed its annual review of the 2021 TSX60 proxy circulars, and we are pleased to share key findings on pay levels, pay design, regulatory updates and Say-on-Pay results. This year’s review has provided specific thoughts and considerations around COVID-19 actions on executive pay in Canada and other emerging trends this proxy season. Please click above for the webinar and download the TSX60 webinar slides here and the full briefing here.
In Summary
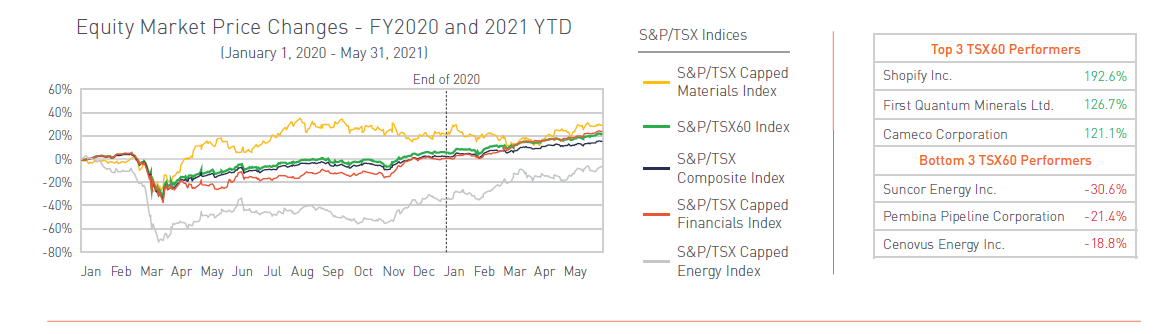
Despite an initial shock to the equity markets in the first quarter of 2020, the TSX rebounded and finished the year at pre-COVID levels. The S&P/TSX has continued its strong growth into 2021, with a YTD return of +15% as of June 1. While the Energy sector in particular was impacted by both COVID-19 and falling oil prices, 2021 YTD returns have indicated a significant rebound, with the S&P/TSX Capped Energy Index returning 50% in 2021. Due to COVID-19, executive compensation became an increasingly important topic for shareholders as they observed how management and boards navigated the pandemic.
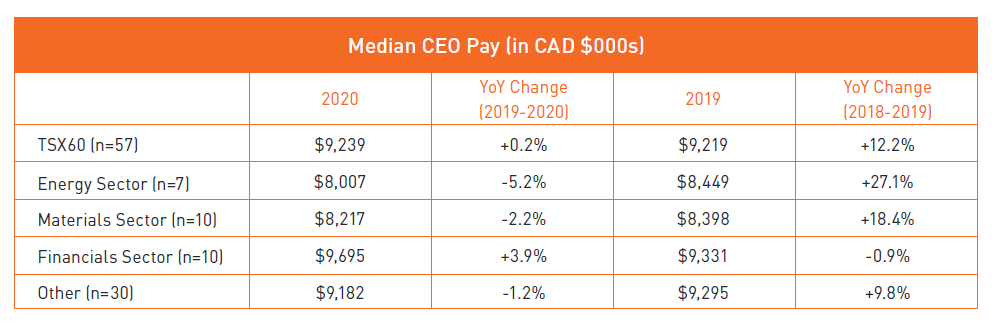
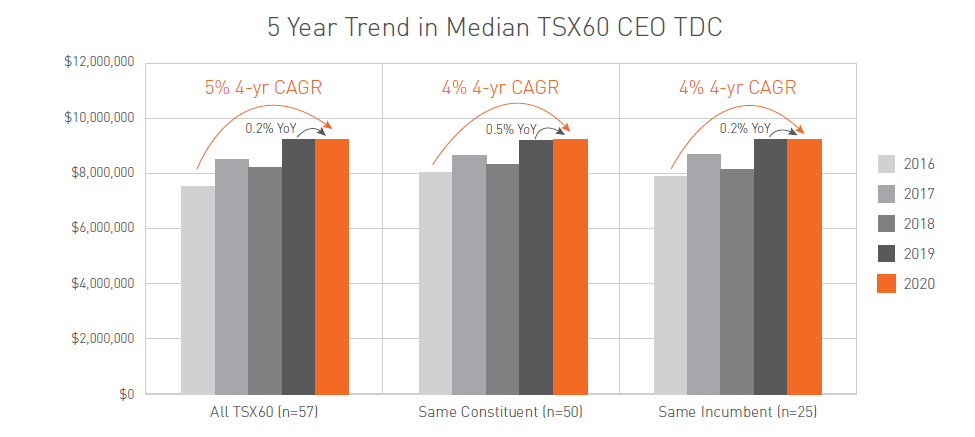
Among the TSX60 in 2020, median CEO total direct compensation (sum of base salary, annual bonus and grant date value of long-term incentives) remained stable year-over-year. This follows an increase of 12% in the year prior. Median CEO pay in the Energy and Materials sectors declined slightly (-1% and -2%, respectively) after seeing significant gains last year of 27% and 22%.
Incentive plan design remained relatively stable compared to 2019, with the most notable change being the modest increase in use of ESG metrics in corporate scorecards. We expect this trend to continue as shareholders increase their emphasis on items related to environment, social, and governance topics.
2020 saw a marked decrease in the use of stock options, with 68% of constituents using stock options (compared to 75% in 2019). Six additional TSX60 companies announced that they will no longer use stock options in 2021. In lieu of stock options, companies have tended to increase the use of RSUs rather than PSUs.
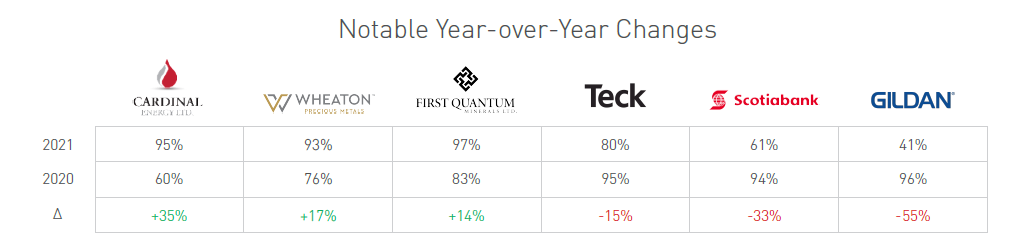
Consistent with 2020, the say-on-pay (“SoP”) support through the 2021 proxy season has remained strong with an average support level of 92% for TSX60 companies (and 90% for the broader Canadian market). We note a few significant year-over-year decreases, such as Gildan Activewear with a SoP result of 44% (-55% change YoY), and the Bank of Nova Scotia with a SoP result of 61% (-33% change YoY).
Median director-at-large and Board Chair annual total retainers increased 2% in 2020, compared to the 5% and 6% increases in 2019. The use of a flat fee compensation structure remains common with approximately 80% of the TSX60 constituents using this structure. Companies such as Gildan Activewear and Alimentation Couche-Tard have indicated their intention to transition to a flat fee structure in the coming year.
2020 Pay Levels Update
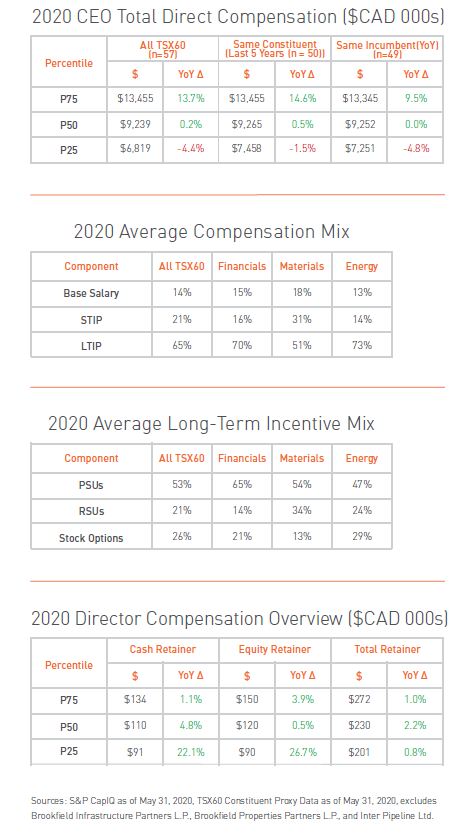
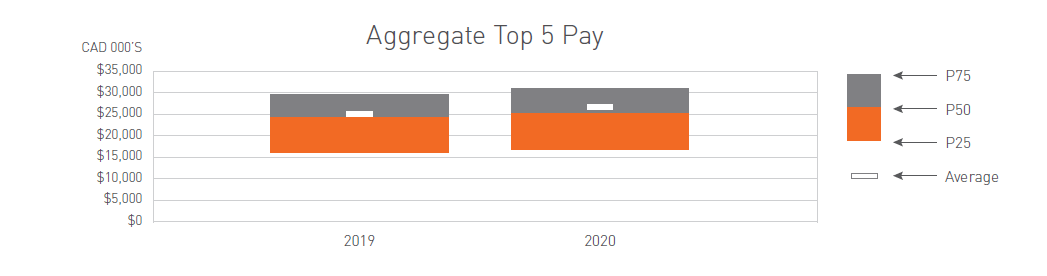
Median actual pay for TSX60 CEOs remained flat year-over-year, while average pay increased by 7%. Additionally, the range of CEO pay outcomes among TSX60 companies widened year-over-year, with the 75th percentile increasing by 14% while the 25th percentile decreased by 4%.
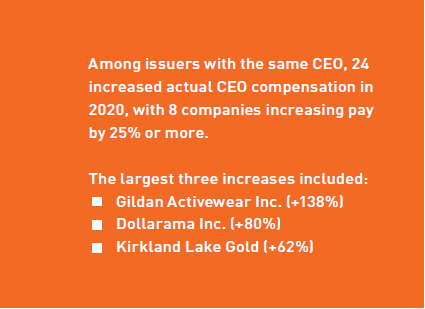
As shown in the table above, the minimal changes observed in 2020 pay levels are in stark contrast to the significant increases seen in the previous proxy season. Overall, we expect the lack of significant pay level changes was driven by the effects of COVID-19 and the resultant increased shareholder scrutiny on executive compensation. Select constituents (as highlighted below) did see notable increases in compensation.
When observing pay levels for companies that have been in the TSX60 for the past 5 years (“Same Constituent”) and for CEOs that have been in their respective roles for 5 years (“Same Incumbent”). Same Constituent CEO compensation increased only 0.5% between 2019 and 2020 but is still at the highest level over a 5-year period. Among Same Incumbent CEOs, the year-over-year compensation was essentially flat (-0.1%), with a 4-year CAGR of 5% growth, a result that is likely driven by the wider variability of the 2020 pay data.
A majority of TSX60 companies have a December 31st year-end. For most of these issuers, both 2020 salaries and 2020 equity awards were determined prior to the first impacts of COVID-19 reaching Canada. As a result, simply looking at the summary compensation table (which discloses the grant date fair value of equity awards), may not fully reflect the impact of the pandemic on overall CEO compensation. A more fulsome picture emerges when considering the change in realizable value of outstanding equity awards.
It is important to note the data represents actual compensation using the grant date fair value of equity awards. While the data suggests that the year-over-year change in compensation was flat, on a realizable basis several executives would have experienced significant fluctuations in their wealth: those in the technology sector may have seen a marked increase in the value of their equity, while those in the energy sector would have seen a significant decrease.
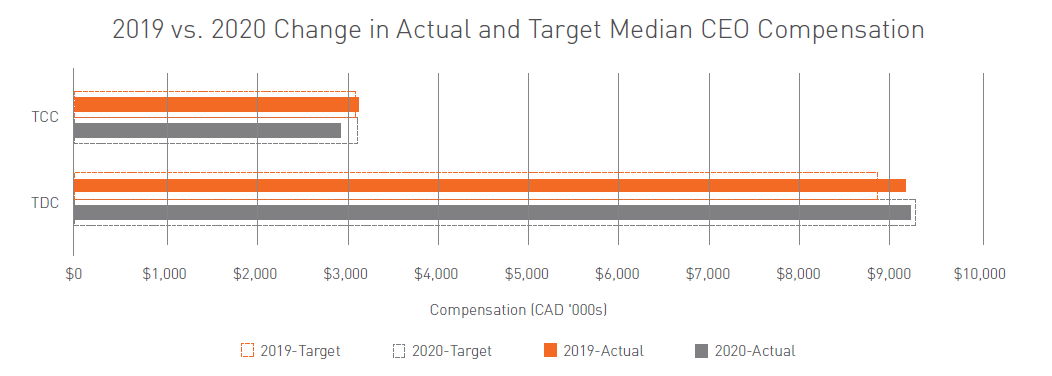
Changes to Target Compensation Levels
When looking at the change in target versus actual compensation, the median of target total cash compensation (“TCC”) was generally flat between 2019 and 2020, while actual TCC decreased by 7%. As noted above, actual total direct compensation (“TDC”) remained flat, but target TDC increased by 5%.
Named Executive Officer Compensation
For the top 5 named executive officers (“NEOs”), total pay at median increased 4% to $25.5 million.
Pay Design Update
Short-term incentive plan
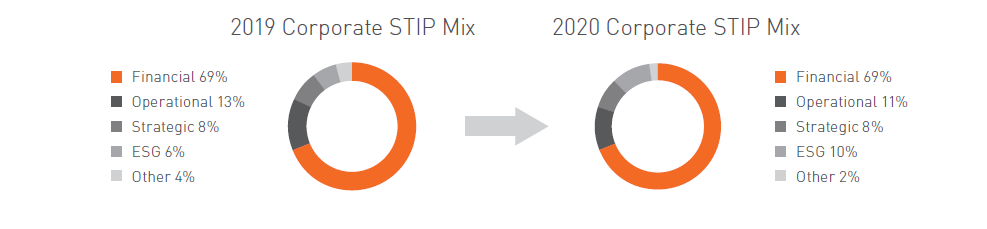
On average, companies within the TSX60 use a short-term corporate scorecard with six metrics, with seven constituents disclosing over 10 metrics (note: our STIP analysis excludes any “individual” scorecard components). Use of financial metrics in the corporate STIP scorecard remained flat at 69%, while use of operational metrics (quantitative metrics that are non-financial metrics and are not measured on a dollar basis) declined marginally. Additionally, the average weight of ESG metrics in constituent corporate STIP scorecard s increased in 2020 from 6% to 10%. 37 TSX60 companies have incorporated ESG in the STIP to some degree.
Long-term incentive plan
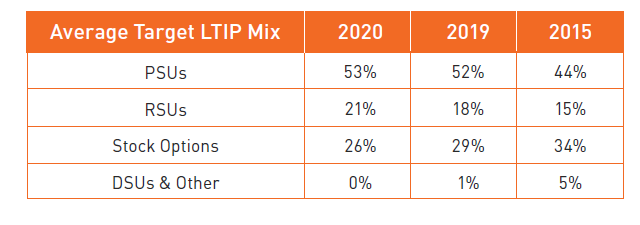
In 2020, the average target CEO LTIP mix saw a continued shift away from stock options (see table below). The overall prevalence of stock options has decreased as well, with 68 % of the TSX60 constituents using stock options in 2020 compared to 75% in 2019. We also note that a number of issuers have either removed stock options from their 2020 LTIP mixes or disclosed their intention to do so in 2021: First Quantum, Franco-Nevada, Cameco, Kinross Gold, BCE, and Manulife.
The recent change in stock option taxation may create an opportunity for some companies to review their long-term incentive plans. This topic is discussed in further detail in the “Other Relevant Topics” section.
Director Compensation Update
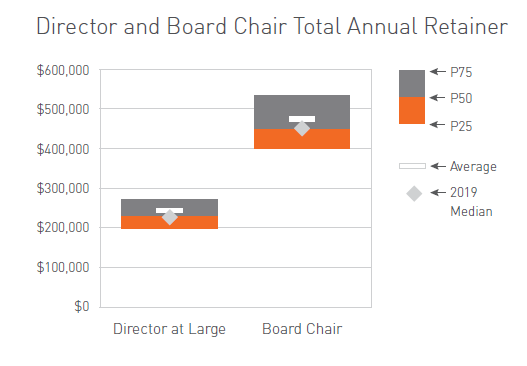
The median total annual retainer (including equity)1 paid to non-executive directors increased by 2% in 2020 to approximately $230K, while median Board Chair pay remained flat at $450K. In response to COVID-19, a number of Boards opted to reduce or forego director retainers. This impacts of COVID-19 on director compensation are discussed in more detail in the “COVID-19 Update” section of this briefing.
Aside from COVID-19 impacts, no major changes to director compensation structure or approach were observed this year.
Say-on-Pay Update
2021 Say-on-Pay (“SoP”) results to date are aligned with recent years in terms of average support levels:
- Average YTD SoP support for the TSX60 issuers is 92.5% among the 41 companies that have held Annual General Meetings as of July 5, 2021, compared to an average SoP of 93.1% across 46 constituents at this time in 2020.
- Gildan Activewear had the largest decline in SoP and received an “Against” recommendation from notable proxy advisor ISS.
In our experience, SoP votes are at times used as an avenue for shareholders to express their discontent towards management or directors, often due to weak company performance. Accordingly, issuers experiencing negative SoP results may wish to engage directly with their shareholders to better understand the underlying reasons for the vote results.
COVID-19 Update
The impacts of the COVID-19 pandemic were wide-reaching, as were the experiences of companies across Canada. Several industries were significantly impacted by the pandemic from a financial perspective, especially in the hospitality and energy sectors. However, companies in sectors such as grocery, retail, and technology benefitted significantly as the landscape changed. Navigating the situation was challenging for all as there was no precedent informing how companies should proceed. The onset of COVID-19 had characteristics that distinguished it from events in the past (e.g., ’08-’09 financial crisis). Based on Hugessen’s experience, a majority of the COVID-related compensation discussions were focused on pay philosophy: should the company maintain their pay-for-performance philosophy and see pay levels dramatically decline, or should they shift their philosophy to reward management for their effort and crisis management abilities?
From a compensation and incentives perspective, companies’ responses to COVID-19 needed to balance the continued retention and incentivization of key talent, with prudent, yet flexible, decision-making that addressed a variety of stakeholder considerations. Many companies, particularly those hardest hit by the pandemic, took quick action to cut executive salaries and director retainers. Beyond these actions, most took a “wait and see” approach as it related to incentives plans, opting not to modify the short and long-term programs mid-year, but rather wait to apply informed discretion at the end of the year. This would provide a full view of both annual financial and non-financial performance outcomes.
Based on our experience supporting our clients with these complex decisions and data collected from our TSX60 review, we observed a generally judicious approach when assessing performance as it related to the annual bonus and PSU award payouts. Three recurring themes were observed:
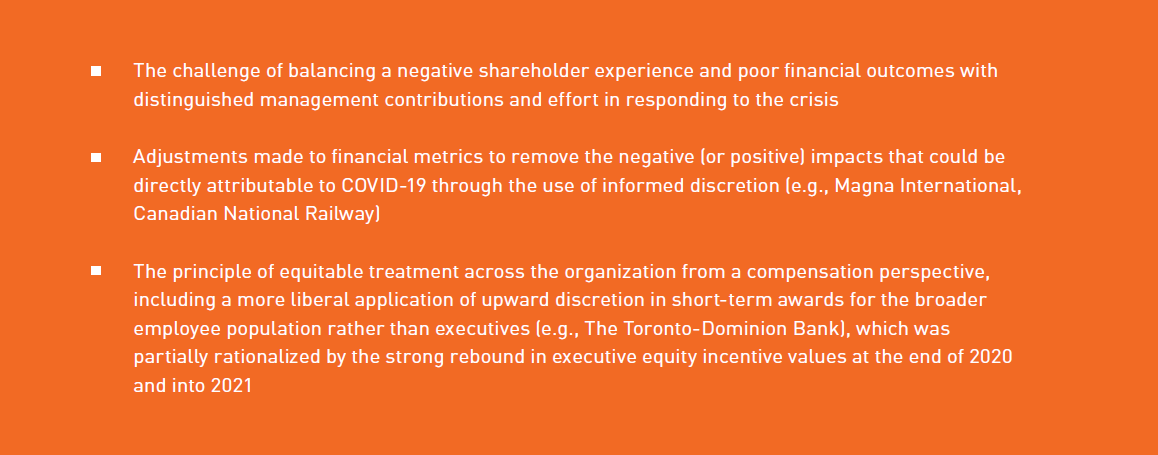
COVID-19 also focused shareholder attention on problematic pay practices. Several Canadian issuers have received public scrutiny in recent months due to their executive compensation decisions, and there were a number of cases where shareholders were vocal in their disapproval. A common factor that fueled negative reactions towards executive pay was a significant disconnect between pay and performance (as measured by relative total shareholder return), spurred by the granting of one-time awards and questionable application of upward discretion. The use of judgement in short-term incentive plans increased from 17% to 43% in 2020. While the significant use of discretion in 2020 may be due to the exceptional nature of the year, it could also mark a turning point where the use of discretion becomes more commonplace as the stigma surrounding its use has lessened. In this regard, proxy advisors were generally pragmatic when assessing the appropriateness of incentive plan awards, and both ISS and Glass Lewis were generally supportive of decisions made, including when positive discretion was exercised.
Looking forward, most companies did not make material modifications to their incentive plans in 2021, but instead made minor adjustments that reflected the continued uncertainty surrounding 2021 performance expectations. Human Resources Committees and management teams were faced with the challenge of setting annual and multi-year financial performance targets in this environment – an already difficult task further exacerbated by the uncertainties of the pandemic. Issuers worked to adapt their incentive frameworks to the uncertain times, forecasting the rebound as best they could, and applying general principles around consistent performance measurement. Some of the specific design modifications applied in 2021 included:
-
Widening performance shoulders for financial metrics in annual bonus and PSU frameworks
-
Inclusion and/or increased weighting towards non-financial measures for annual bonus purposes, as well as the use of the formal discretionary component (e.g., BCE, Fortis)
-
Increased use of relative performance metrics for PSUs, which in some cases did not require financial forecasting (e.g., BCE), extending performance periods for outstanding grants (e.g., CCL Industries), modifying outstanding targets while reducing payout opportunities (e.g., Restaurant Brands International), as well as measuring both one-year and three-year performance periods to stabilize measurement periods and/or delaying the setting of 3-year financial targets until there is sufficient comfort in setting targets
Overall, the impacts of COVID-19 created a challenging dynamic when assessing year-end performance. In many cases, HR Committees had to weigh the relative implications of poor financial performance outcomes, with management retention and motivation considerations. Going forward and as economic and financial prospects recover, companies should be in a better position to make program adjustments (informed by shareholder feedback) that will support prudent compensation decision-making at year-end.
ESG Update
In response to the increased focus on ESG, companies have taken steps to incorporate ESG metrics into their incentive plan design. 63% of the TSX60 constituents have implemented at least one ESG metric into their incentive plan, with an average weight of 20%.
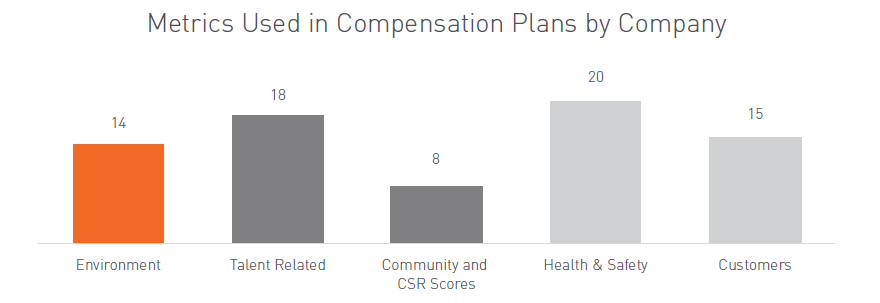
Energy and materials companies are leading the way in implementing environmental metrics into incentive plans, though these metrics typically relate to compliance and environmental risk management rather than greenhouse gas emissions and climate strategy. These metrics are more often found in short-term incentive programs, though we expect this is because a large portion of metrics used have an inherently short-term focus (e.g., health and safety, customer satisfaction). Additionally, companies may be taking a “walk before you run” approach, whereby newer metrics are being tested or calibrated in the short term before they are implemented in longer term incentive plans. The use of Health & Safety and Talent-related metrics with the most common, being used in 20 and 18 companies' incentive plans, respectively. Additionally, Customer-related metrics were also common, being included in 15 constituents' plans.
As discussed in our 2020 TSX60 Briefing, the focus on the “S” portion of ESG continued to rise in prevalence, specifically with regards to Diversity, Equity, and Inclusion (“DE&I”). Notable examples of DE&I and talent-related metrics in incentive plans can be found at The Royal Bank of Canada, Barrick Gold, and Manulife.
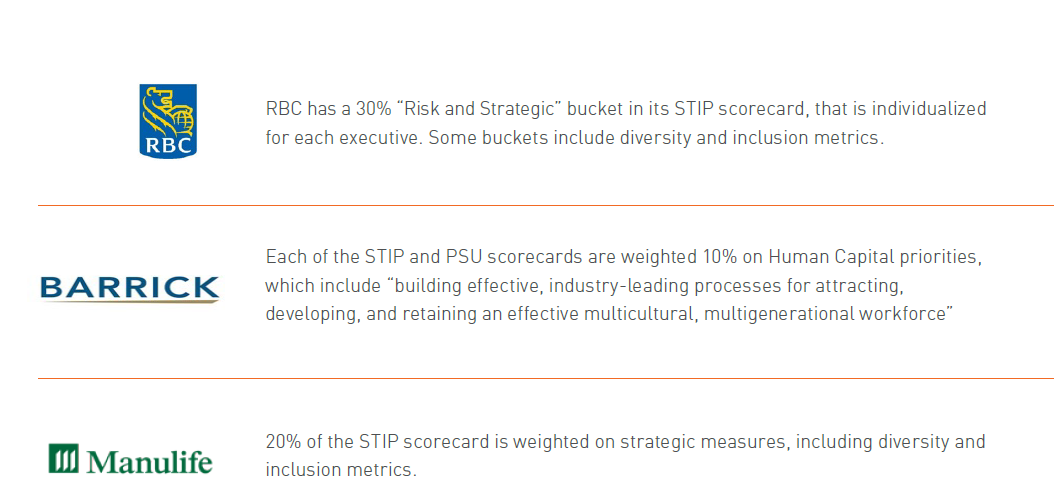
While only 4 TSX60 constituents disclosed a DE&I metric in their incentive plans for 2020, we expect the increased adoption of DE&I metrics as DE&I continues to gain prevalence in ESG-related conversations.
Stay tuned for future briefings from Hugessen on emerging trends in the intersection between executive compensation and ESG.
Other Relevant Topics
Stock Option Taxation
The long-anticipated changes to Canadian stock option taxation rules became effective July 1, 2021 and apply to non-Canadian Controlled Private Companies with annual revenue in excess of $500 million. All stock options granted by these companies above a $200K limit will now be taxed at marginal income tax rates, similar to other equity instruments such as RSUs and PSUs. At the same time, the Company will receive a corresponding tax-deductible expense equal to the in-the-money benefit when the fully taxable stock options are exercised.
These changes mark an opportune time for companies to review their LTIP design approaches. For more details on these changes, please see our thought capital pieces, including: “Proposed Changes to Stock Option Taxation” and “Reassessing Long-Term Incentive Design”.
Record-Setting Initial Public Offering Activity
2021 is also on pace to be a record-setting year for IPO activity in Canada, with dozens of companies having recently gone public, announced their intentions to do so, or in the preparatory stages. From a compensation perspective, pursuing an IPO creates a prime opportunity for companies to review and enhance their governance and incentive frameworks for public market consumption. This activity also has broader human capital implications as newfound access to publicly traded equity offers a flexible currency for facilitating talent attraction and retention and ratcheting up the competition for talent in high-growth sectors.
Conclusion
2020 was an unprecedented year for Canada and its largest companies. The volatility and uncertainty created by the COVID-19 pandemic led to numerous challenges in the setting and monitoring of business objectives and assessment of performance at year-end. Overall, CEO compensation among TSX60 constituents remained relatively flat year-over-year, and Boards exercised the informed use of judgement and discretion in making year-end compensation decisions.
While the initial impact of COVID-19 has passed, the pandemic continues to create new business challenges that issuers will be forced to navigate. In particular, we expect issues such as the setting of appropriate short and long-term performance targets and addressing the pandemic’s impact on long-term incentive programs will be top of mind.
1 Note these amounts exclude Committee fees.