Hugessen has completed its annual review of the 2024 TSX60 proxy circulars, and we are pleased to share key findings on executive pay levels, incentive design, Say-on-Pay results, and other governance topics.
This webinar addresses how Boards are navigating modern issues and trends tied to executive compensation, governance, ESG, and Board effectiveness.
Summary
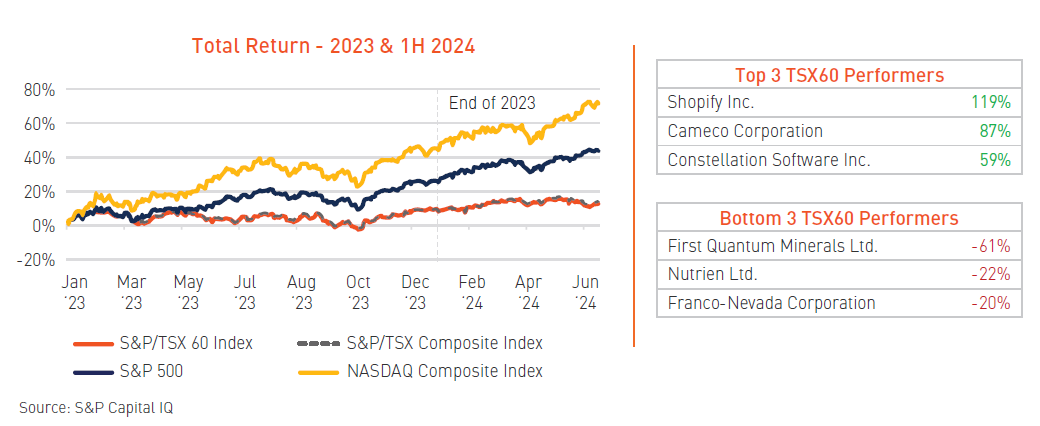
As Canadians continued to battle inflationary headwinds in 2023, equity markets looked to snap the losses from the prior year with a late rally in the fourth quarter. While the path through to the end of Q3 may have left many questioning the market’s resilience, the S&P/TSX 60 Index closed the year with a positive return of approximately 8%, marking a reversal from the 8% decline recorded in 2022. Financials, Technology, and Real Estate led the markets on the expectation of interest cuts by the Bank of Canada; however, the Canadian market’s performance significantly lagged US equities, a trend which has continued through the first half of 2024.
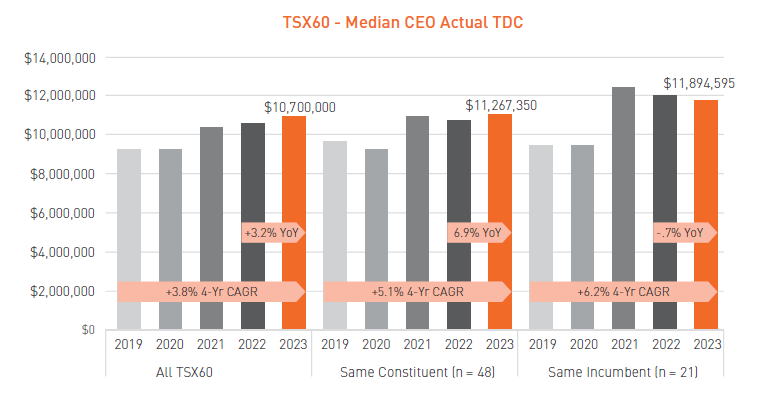
Among the TSX60 in 2023, median actual CEO total direct compensation (“TDC”) increased year-over-year by 3.2%, whereas same incumbent CEOs remained relatively flat with a 0.7% decline relative to 2022. The increase in median actual CEO TDC in 2023 follows a relatively flat 2022 (+0.1%), which has been driven largely by increases in median base salaries and long-term incentive awards (2.6% and 3.5%, respectively), while short-term corporate scorecard results declined year-over-year (i.e., ~116% in 2022 vs. ~108% in 2023, on average).
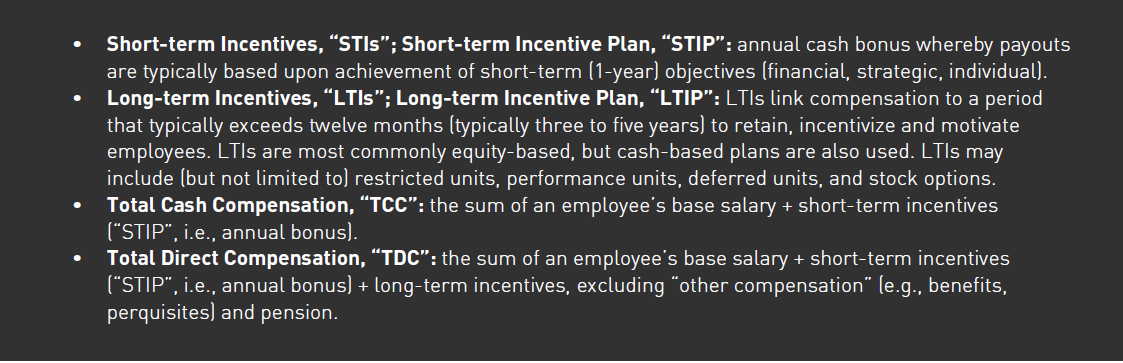
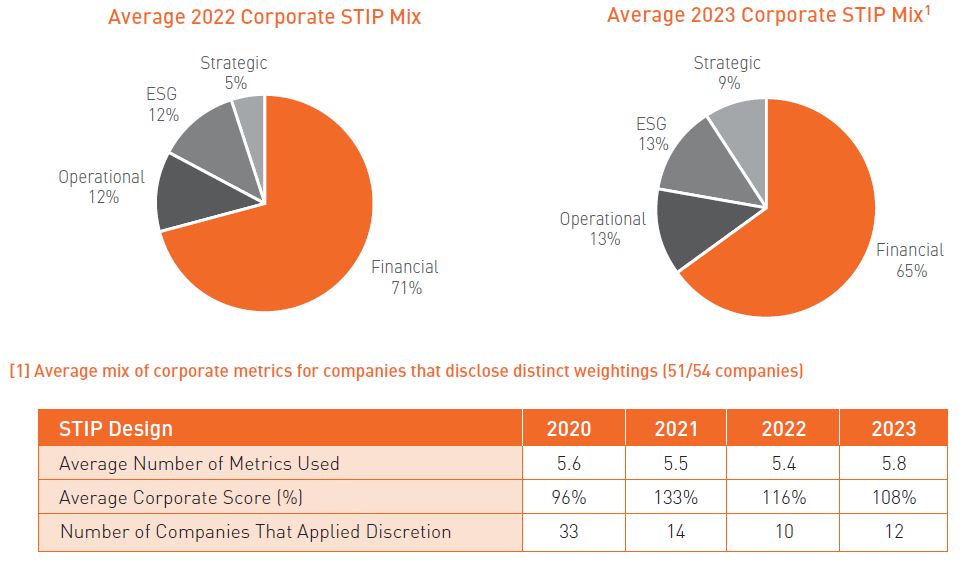
Short-term incentive plan (“STIP”) design remained relatively stable year-over year. While financial metrics remain the highest weighted performance measure with an average STIP scorecard weighting of ~65%, the average weighting decreased from 71% in 2022. The use of formalized discretion among TSX60 issuers in 2023 (i.e., adjustments to CEO STIP payouts made by the Board/Human Resources Committee that fall beyond the formulaically driven results) remained relatively stable year-over-year with 12 companies overriding formulas compared to 10 companies in 2022.
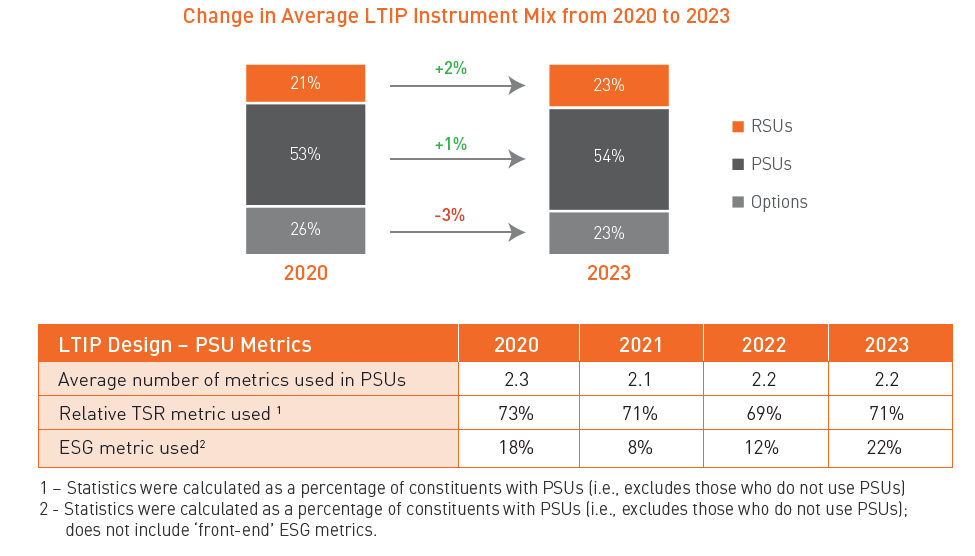
Long-term incentive plan (“LTIP”) instrument mixes have seen little change year-over-year, with PSUs continuing to account for the majority of awards (average of 54% of LTIP among TSX60 issuers) with restricted share units and stock options each accounting for 23% of the average LTIP mix. Relative Total Shareholder Return continues to be the most prevalent PSU metric. There was a material increase in the use of ESG metrics, with 22% of companies with PSUs now incorporating some form of ESG measure, up from 12% in 2022.
2023 Pay Levels Update
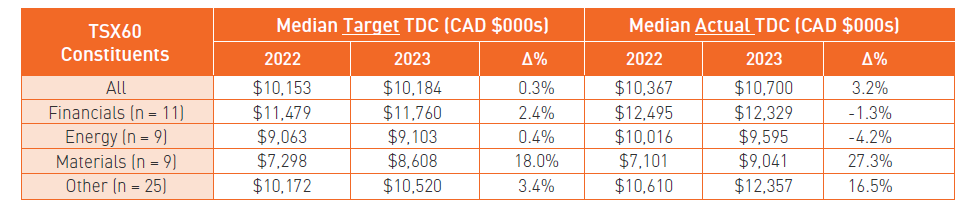
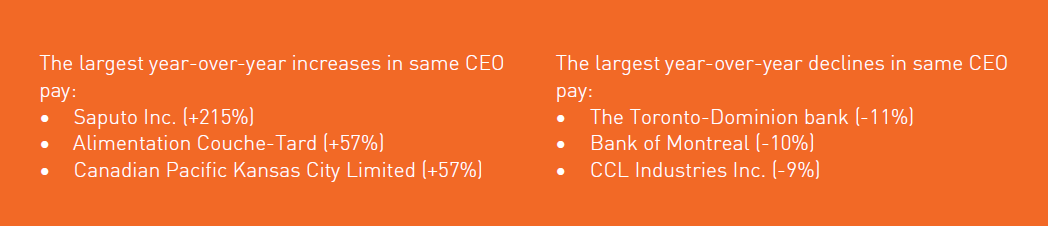
Median target CEO compensation among TSX60 issuers remained relatively flat in 2023; however, median actual CEO compensation increased 3.2% year-over-year. Some sectors, such as materials and technology, have experienced more sizeable increases in actual CEO pay relative to the broader index. For materials companies, this appears to be largely a rebound from 2022 which saw actual CEO TDC decline by ~15%.
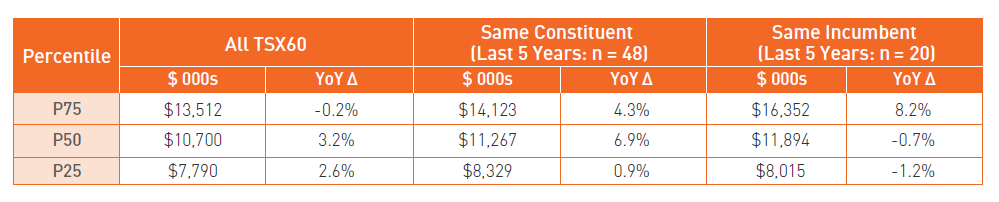
Among companies that have been in the TSX60 for the past 5 years (“Same Constituent”) and for CEOs that have been in their respective roles for 5 years (“Same Incumbent”), both experienced increases at the median of approximately 6.9% and 3.8%, respectively, in actual total direct compensation in 2023. When assessing the growth in CEO pay over the last 5 years, “Same Constituent” CEO actual compensation recorded a compounded annual growth rate (“CAGR”) of approximately 5.1%, whereas “Same Incumbent” CEOs recorded a slightly higher CAGR of approximately 6.2% (see illustration below).
Pay Design Update
Short-Term Incentive Plan
Financial metrics remain the most used and highest weighted performance measures in 2023 (i.e., 50 companies disclose the use of a financial metric), although their weighting has decreased since 2022 (65% in 2023 vs. 71% in 2022). Several companies reduced their financial weighting in favour of operational, strategic, or ESG initiatives. During periods of increased volatility, the inclusion of qualitative metrics can decrease the volatility of the program.
Earnings metrics reflect the most prevalent financial measure (i.e., 78% of companies with a financial metric have an earnings measure (EBITDA, EPS, etc.) weighted at ~36%, on average). The implementation of ESG metrics remained relatively stable year-over-year. Among those companies that have ESG metrics in their STIP, they made up 18% of corporate scorecards on average. There was a significant increase in community-based metrics within the STIP – the most commonly stakeholder engagement and philanthropy measures (by 13 of 15 of companies that have these metrics).
Broadly, we are seeing a move towards the use of discrete ESG metrics in the STIP, and a move away from the approach of basketing of multiple metrics.
Regarding the size of STIP scorecards, the number of metrics has historically been steady, ranging between 5 and 6 metrics. The average corporate score has declined by approximately 8% year-over-year to 108% in 2023; a similar trend was experienced in 2022 when the average corporate score decreased from 133% in 2021 to 116%.
2023 saw a continuation of the trend of reduced use of discretion by Boards and/or Human Resources Committees with respect to short-term incentive payouts (i.e., adjustments to payouts beyond the formulaic result). As highlighted by the table below, 12 companies in the TSX60 formally applied discretion in 2023, compared to 10 in 2022 and 14 in 2021.
Long-Term Incentive Plan
Performance share units (“PSUs”) continue to be the most widely used instrument (i.e., 50 companies use PSUs), reflecting the highest weighting as part of the LTIP (i.e., > 50%, on average) among TSX60 issuers. Relative total shareholder return (“RTSR”) remains the most prominent PSU metric, used by ~71% of companies that award PSUs, followed by return measures (i.e., ROIC, ROE, ROCE, etc.), which are included by ~41% of companies with PSUs.
The average mix of long-term incentive instruments among the TSX60 remains steady, with a marginal decrease of options in favour of PSUs and RSUs. Stock options continue to be a prevalent instrument with 60% of the TSX60 awarding them in 2023. With the change to capital gains taxation implemented June 25, 2024, the inclusion rate for qualified options increases to 66.7% from 50%. Similar to the more material stock option taxation changes implemented in 2021, we do not expect the prevalence of stock options to materially change as a result of the new taxation rules going forward.
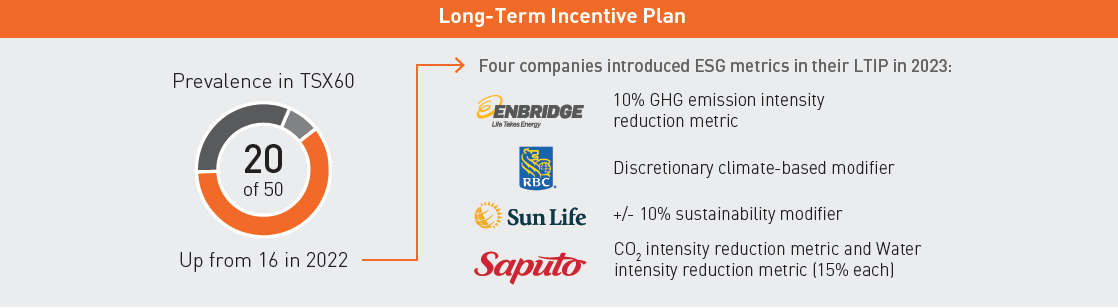
In 2023, we saw continued momentum in the adoption of ESG metrics in long-term incentive plans with 4 new companies incorporating ESG measures. All but one of the companies disclosing ESG metrics in the LTIP also use ESG measures within the STIP, which aligns with our expected evolution of practice in this area – companies have generally taken the approach of incorporating ESG metrics as a basket approach or in an individual measure within the STIP as a first step and, as comfort with adjudicating performance grows, companies begin to incorporate them in the long-term plans.

Say-on-Pay Update
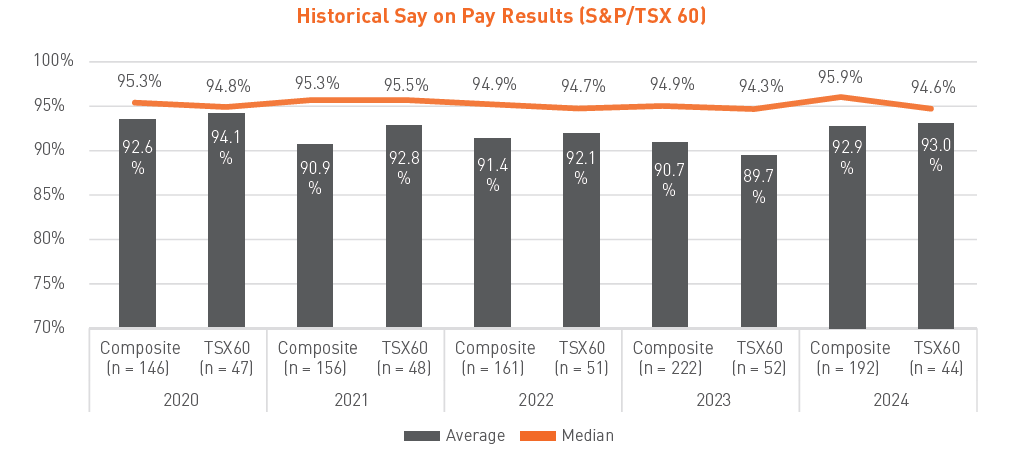
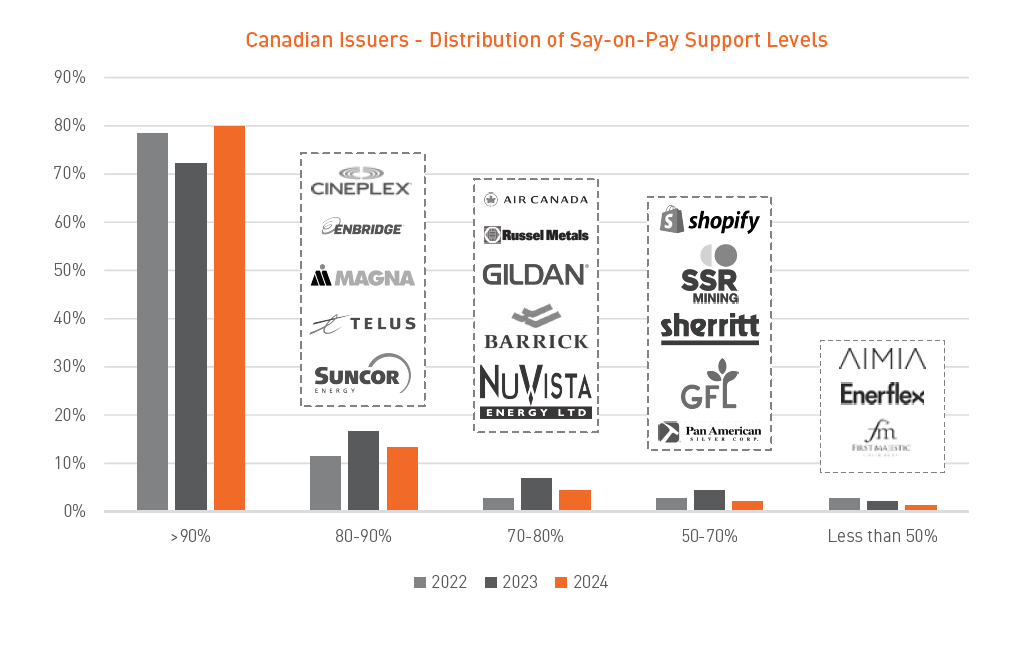
We are observing an increase in Say-on-Pay support levels relative to 2023 across the TSX:
- Canadian issuers are recorded an average voting result of ~92.6% (compared to ~90% in 2023)
- The number of companies scoring above 90% has increased to 80% of companies in 2024 compared to 73% in 2023
- The number of companies that failed SoP declined from 4 in 2023 to 2 in 2024.
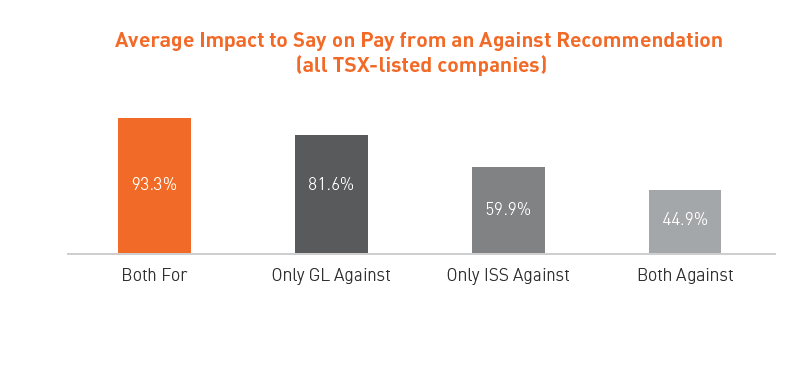
Proxy advisors continue to have a high level of influence on Say-on-Pay outcomes. In situations where both ISS and Glass Lewis recommended voting against there was an average of ~50% decrease in votes “for” the proposal. In the case of a split vote recommendation (one proxy advisor recommended in favour and the other recommended against), ISS generally has a more meaningful impact to voting results than Glass Lewis. Among the companies that received below 80% support on their Say on Pay resolutions, the common flag raised by both Institutional Shareholder Services (“ISS”) and Glass Lewis (“GL”) was a misalignment between pay and performance followed by problematic pay practices (e.g., one-time awards, CEO pay ratio disparity, etc.). (See previous article: Impact of Proxy Advisor Voting Recommendations)
Board Effectiveness
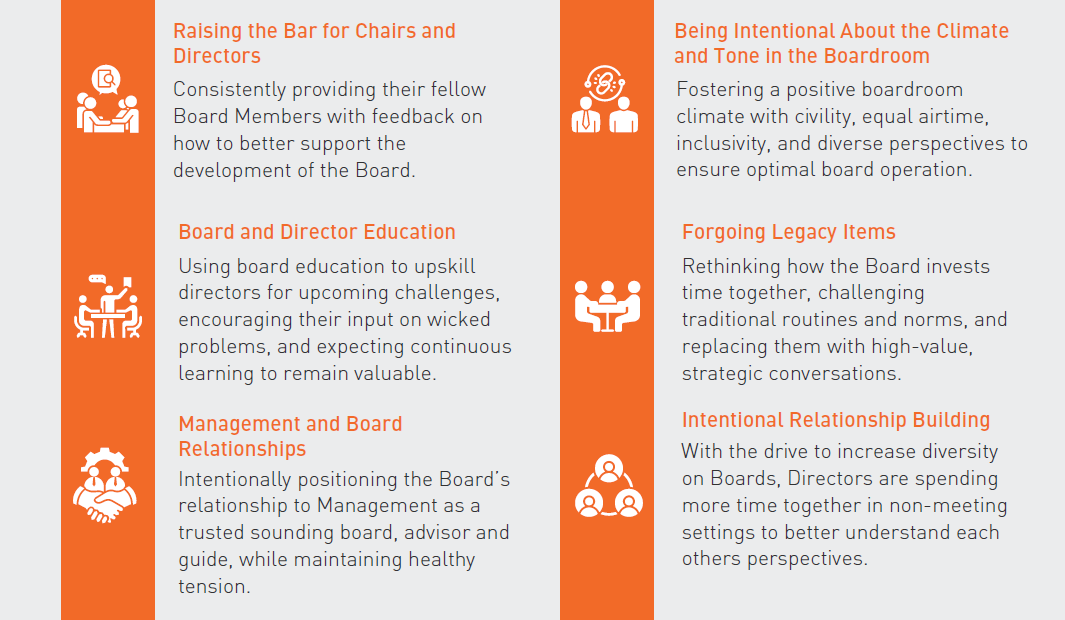
The complexity and uncertainty in the current macroeconomic landscape are driving the need for Boards to re-evaluate their role and focus. We have identified 6 key trends among high performing Boards which are helping in the development of an “ideal state.”
As Boards seek to fully understand their own performance and address any gaps that may exist, we see an increase in the incorporation of diversity targets, 3rd party perspectives, and upward management feedback into evaluations:
- 88% of TSX60 Boards have a formal target for gender diversity, generally at 30% representation of women
- 23% of Boards have a formal target for visible minorities, BIPOC, and other designated groups
- More than 50% of Boards indicate they utilize third-party service providers for their Board Effectiveness surveys
- In 2023, approximately one-quarter of firms in the TSX60 incorporates Management’s input into Board assessments
Regulatory and Proxy Advisor Trends
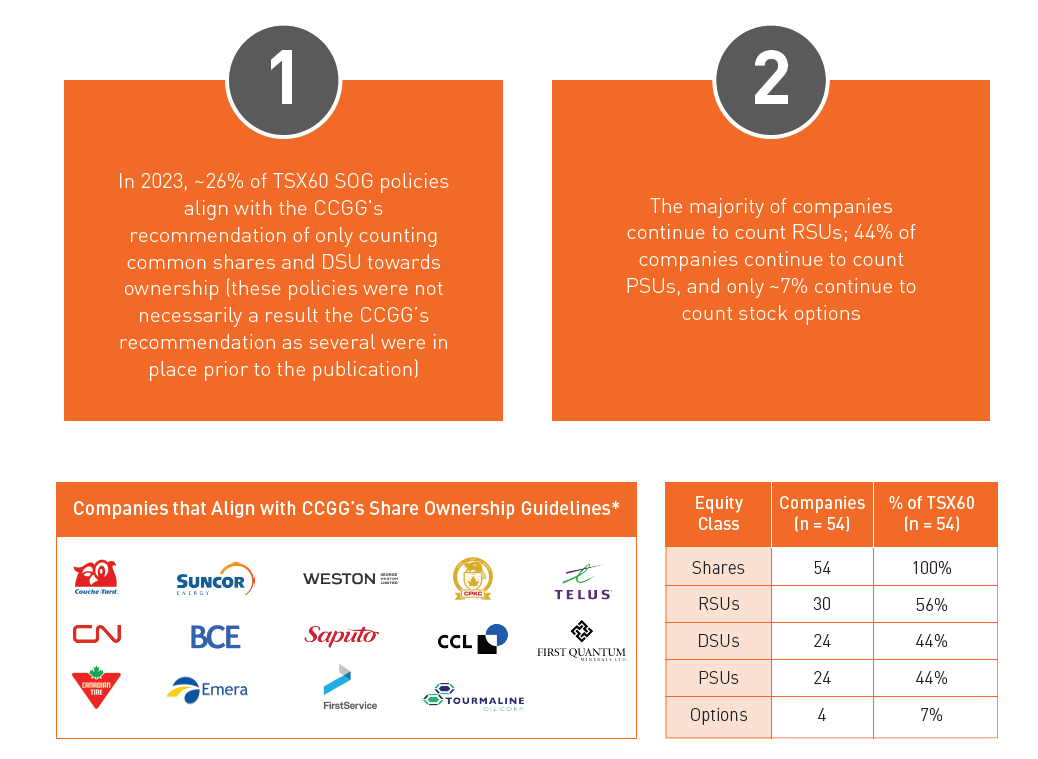
Share Ownership Guidelines
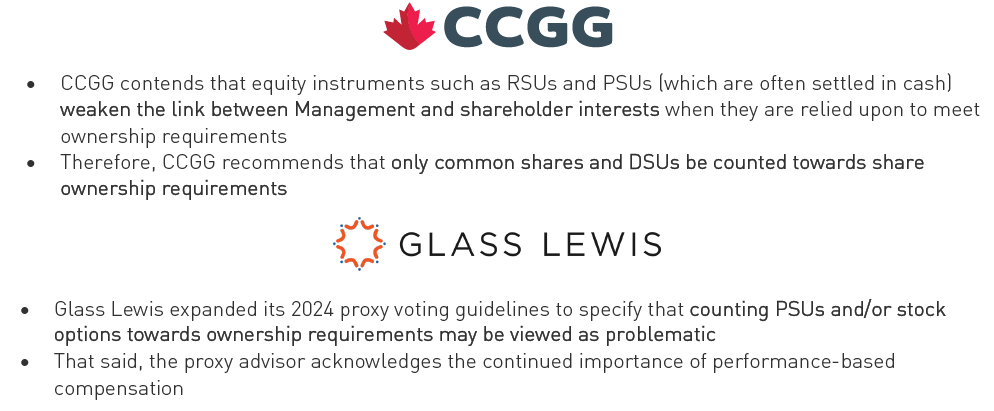
In 2023, shareholder groups took a stronger stance on executive ownership. The Canadian Coalition for Good Governance (“CCGG”) published a report outlining recommendations for more effective share ownership policies, echoed in Glass Lewis’ updated proxy voting guidelines.
Conclusion
With 2023's relatively lackluster performance among the broad TSX60 group, particularly compared to the US, Boards have generally allowed incentive plans to perform as intended with relatively little instances of discretionary intervention. Target and actual CEO pay levels in 2023 were flat to modestly up, coupled with strong Say-on-Pay support levels broadly across the TSX, signal a new normal with boards’ expectations of management teams that they manage their businesses and perform well within a continued challenging macro environment.
The first half of 2024 has continued where 2023 left off as geopolitical tensions persist, action on climate change and sustainability remains top of mind yet controversial in some realms, countries continue to attempt to control runaway inflation, and all eyes are on central banks for indications of rate cuts. In our discussions with Boards and management teams, we see intentional efforts to evolve how time and focus are better utilized across numerous topics to manage the macroeconomic complexities and transitions currently underway. This includes topics such as short-term vs long-term focus, operational vs strategic thinking, inward looking vs external scanning, consistency vs innovation and the “what” vs “so-what”.
Boards and Human Resources Committees will continue to grapple with the everchanging landscape of external scrutiny and the need to balance the right course of action for their businesses. Similar to the evolution of ESG in recent years, other less clearly quantifiable performance issues, such as navigating changing demographics in the workforce and managing digital risk and opportunities, are being discussed at the Board room table with a familiar question that looms large: what does success look like and how should executives be paid for it?